
The 7–day moving average puts the realized loss at 14x larger than the realized profit, however, the severity of losses is diminishing
Recent weeks in the Cryptoverse have just highlighted some of the problems that the digital assets space has seen this year. Turbulent deleveraging in the wake of the FTX implosion was one such significant event. Before that, we saw the multibillion-dollar collapse of the Terra/Luna stablecoin project in May. Needless to say, any progress made to halt the bear run in 2022 was promptly derailed.
Price action in Bitcoin and the associated cryptos have been a testament to the speed bumps faced by digital assets this year. Coming back to the FTX event, it saw a historic capitulation of an all-time high (ATH) one-day loss of -$4.435B. According to Glassnode's research, we can measure the severity of the loss by inspecting the ratio between realized profit and realized loss.
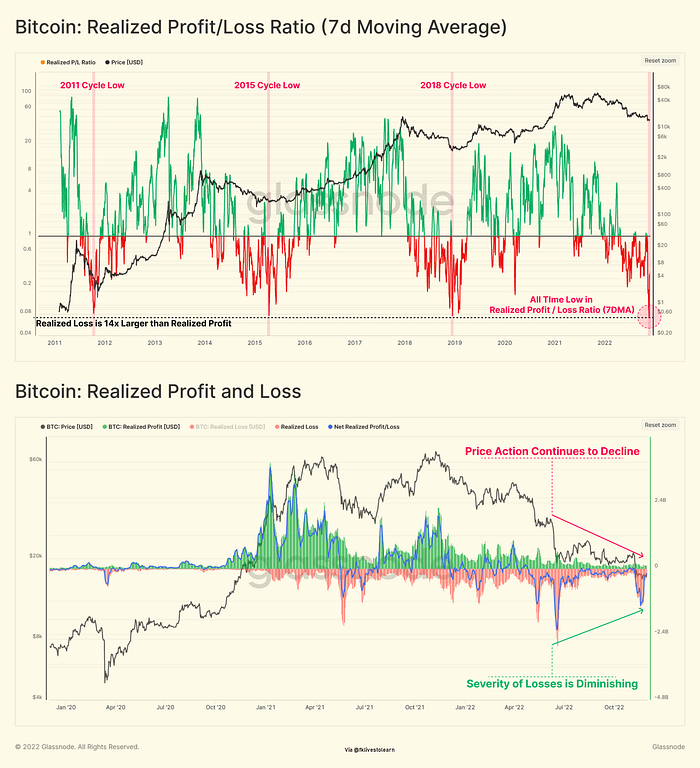
As you can see in the top chart above, the ratio between realized profit, and realized loss — losses locked in by the market were 14x larger than profit-taking events. Please note that previous instances of extremely low Realized Profit/Loss ratios at this scale have historically coincided with a macro market regime shift — in 2011, 2015, 2019, and 2020.
But there’s a silver lining too. According to the bottom chart, losses seem to be subsiding, when assessed with a weekly moving average. Compared to the most recent loss, the post-LUNA June sell-off, by comparison, sustained over -$700M in losses each day for almost 2 weeks after the event. Having said that, the price action continues to decline in Bitcoin and the stock sell-off induced by recession fears is not helping the case.
Originally Published on Medium
Email | Twitter | LinkedIn | StockTwits | Telegram | Newsletter






