
A data-driven look at how institutional ETF demand is shaping Bitcoin’s price trajectory, and why the current rally may have legs.
The cryptocurrency market is no stranger to narratives that drive price speculation—halvings, institutional adoption, macro headwinds, you name it. But in 2025, one factor stands head and shoulders above the rest in explaining Bitcoin’s current price dynamics: ETF flows. These flows have not only stabilized Bitcoin through turbulent patches but are now propelling it toward new price discoveries, with models pointing to a fair value north of $115,000.
A New Era of Price Discovery
Since their introduction in early 2024, spot Bitcoin ETFs have revolutionized how institutional and retail investors access the digital asset. No longer confined to crypto-native exchanges, investors can now gain exposure through regulated, familiar financial instruments. That access has translated into one critical metric: Flows.
Over the past 30 days alone, Bitcoin (BTC) ETFs have absorbed more than 75,000 BTC in net inflows. To put that in perspective, this level of sustained demand outpaces the monthly issuance from mining by more than threefold. The implications for Bitcoin’s price are profound.
When Flows Speak, Markets Listen
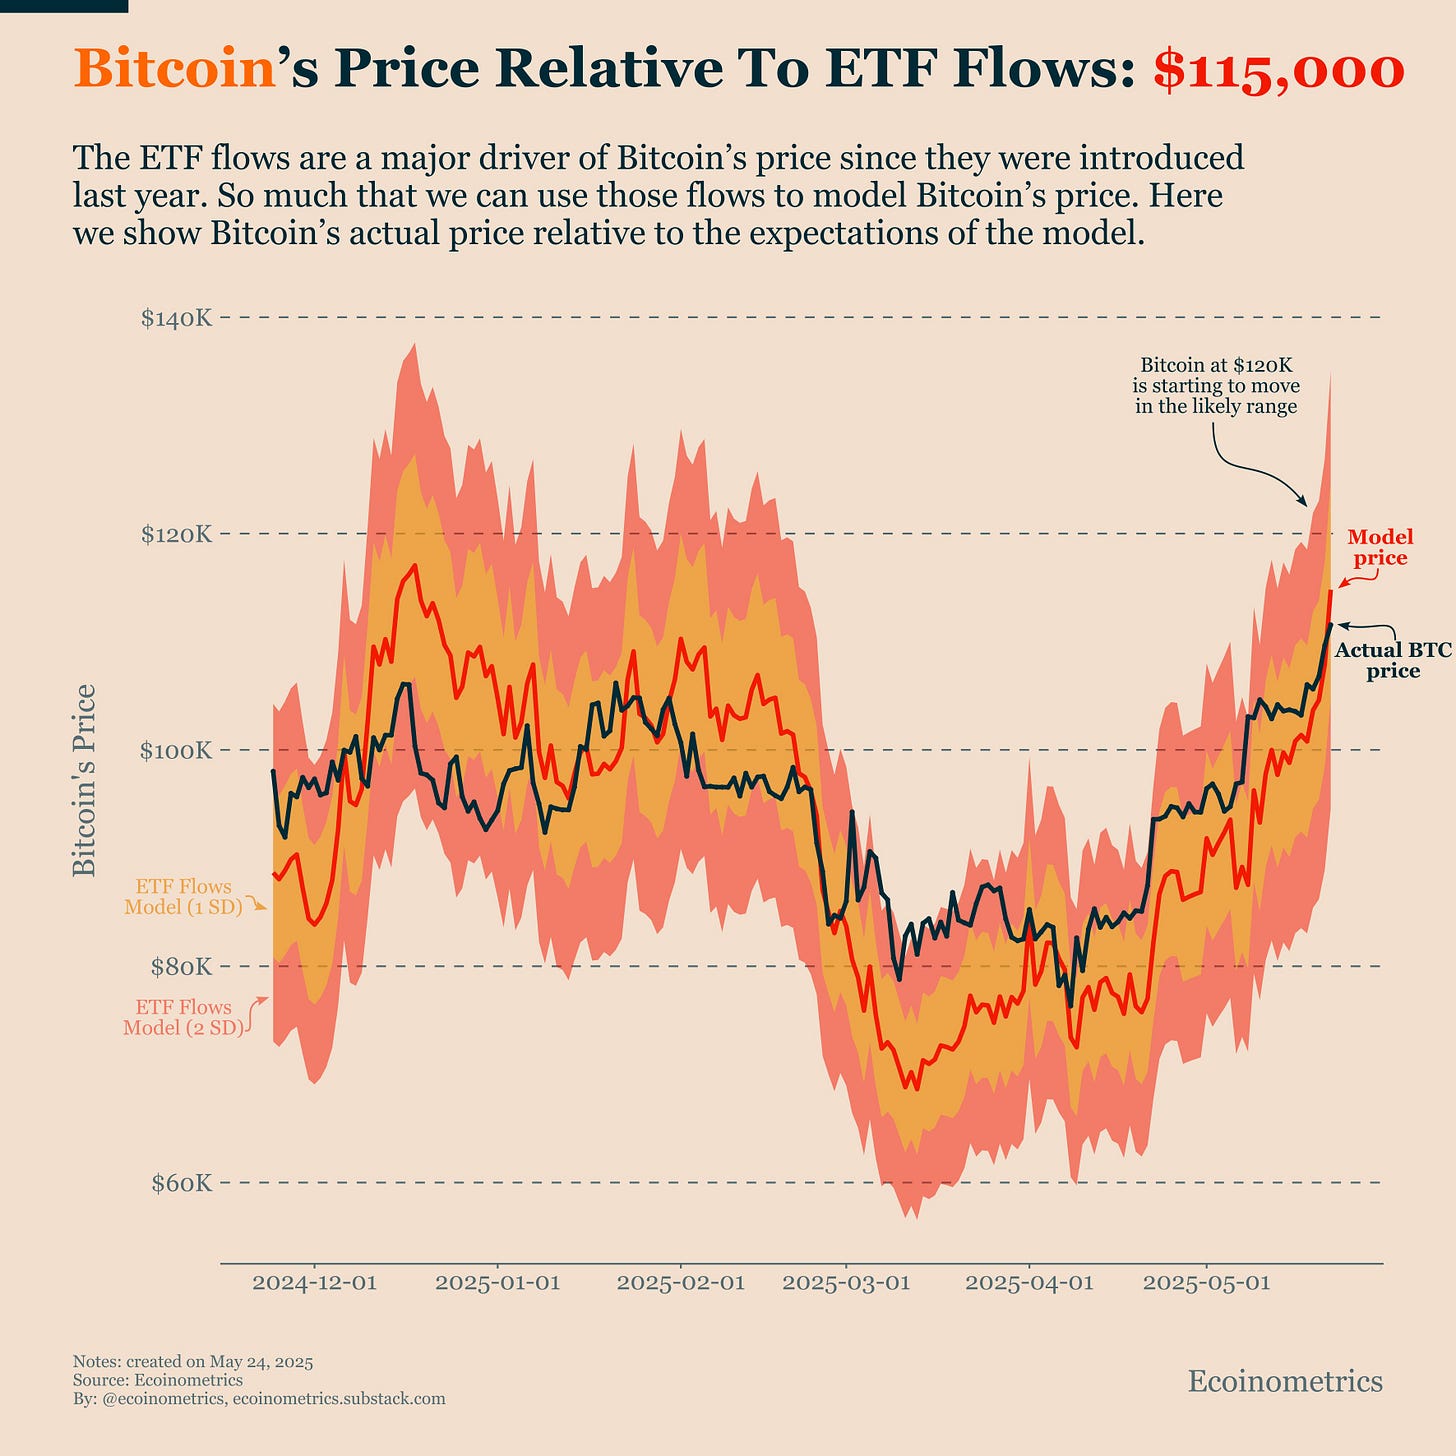
The team at Ecoinometrics has built a quantitative model to correlate Bitcoin ETF flows with the asset’s price. The model uses these flows as an independent variable to estimate a fair value range. And the results are telling. According to the latest data (as of May 24, 2025), the model suggests that at the current pace of inflows, Bitcoin's fair value lies between $105,000 and $125,000.
That estimate centers around a median fair value of $115,000, based on ETF demand alone. Let’s unpack what this means. The chart below illustrates Bitcoin’s actual price relative to the model price derived from ETF flows. The red line marks the model price. Surrounding it are two bands representing standard deviation ranges—the orange band for ±1 SD and the pink band for ±2 SDs. The black line shows the real-world Bitcoin price.
The key takeaway? Bitcoin is not just rising—it’s converging with its modeled value. In early 2025, the price briefly dipped below the lower band (signaling undervaluation relative to flows), but as of May, it's now back in the expected range, currently approaching the $120K mark. In other words, the rally has been driven not by speculative froth but by measurable demand-side pressure via ETFs.
Why 75K BTC in Flows Matters?
The 75,000 BTC accumulated in the last month is more than a bullish statistic—it’s a signal of conviction. This volume of net inflows suggests that investors—many of whom are large institutions—are not just dipping their toes but making meaningful allocations. Historically, this model shows that once ETF flows surpass this threshold, price gains become sustainable rather than speculative. We're no longer in a regime of hope-fueled rallies; this is a demand-driven bull market supported by real capital inflows.
What to Watch Next: Two Possible Scenarios
As with all markets, momentum is only as good as the force sustaining it. So what comes next depends on one critical factor: whether ETF flows remain elevated or begin to taper.
▷ Scenario 1: Flows Stay Elevated
If ETF inflows continue at or above the current rate, we could see Bitcoin not only remain above $115K but push into the upper bound of the model range at $125K and beyond. Price would be tracking the top end of the band, potentially establishing new all-time highs with minimal volatility. This scenario would also likely attract even more inflows as sidelined investors fear missing out, adding fuel to the fire.
▷ Scenario 2: Flows Slow Down
Conversely, should flows start to weaken, the price is likely to drift back toward the center of the model range, around the $105K level. This wouldn’t be a bearish breakdown but a natural regression to the mean. Such a pullback could offer a healthy reset and serve as a new accumulation phase before the next leg higher—especially if macro conditions remain supportive.
A New Bitcoin Market Structure?
ETF flows are now acting as the gravitational anchor for Bitcoin’s price. Unlike in previous bull markets, where price was often disconnected from fundamentals, 2025 may be the year where demand-driven models define price behavior with surprising accuracy.
Here’s what makes this different from 2017 or even 2021:
-
Institutional infrastructure is built and operating.
-
Flows are transparent and trackable.
-
Demand is organic, regulated, and persistent.
In essence, we are no longer trading hype—we are trading balance sheets.
What Next?
Bitcoin at $120,000 is starting to align with what the ETF flows model has been signaling all along. As seen on the chart, this alignment marks a transition from speculation to validation. But investors must remain vigilant. Sustained momentum will require flows to remain strong. That means watching fund inflow reports, analyzing institutional buy pressure, and staying attuned to macro developments that could affect risk appetite.
For now, the trend is unmistakable: ETF flows are doing the heavy lifting, and the model says there’s room to run.
Originally Published on Substack.






