
As far as drawdowns in bull cycles are concerned, Bitcoin has fared much better in the current upswing
It wouldn’t be far-fetched to say that Bitcoin and the associated cryptocurrencies have had a spectacular first quarter of 2023. The premier digital currency was the best-performing asset. When you see such impressive gains, it is only natural in financial markets to see a pause and some consolidation take place, as investors absorb the abundant supply and define the trend, going forward. And this has been the case in cryptos this month.
This week, the Bitcoin market encountered resistance, causing it to drop from its weekly high above $30.5k to a low of $27.2k. Despite this setback, the beginning of 2023 has shown impressive price performance with only a few significant corrections, the largest being a mere -18.6%. Bitcoin and Ethereum encountered congestion at the lows, and have rebounded smartly today — BTC in fact touched $30k.
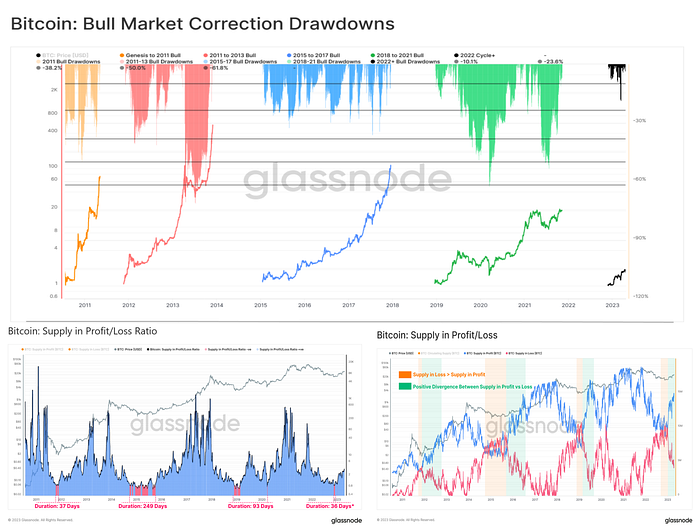
Assuming that the November low represents a longer-term low, we can observe that the current drawdowns during this upward trend are relatively minor when compared to past cycles — evident in the top chart above. Both the 2013 and 2020 drawdowns had massive movements in excess of -60%.
The impressive start to 2023 has allowed the aggregate market to move confidently from a period of unrealized loss to one of unrealized profit, which is evidenced by the significant difference between the supply held in profit versus loss. As this shift occurs, there is a growing incentive to take profits — something that we are seeing currently.
By analyzing the ratio between the supply in profit and supply in loss, we can further confirm this shift (bottom right chart). This oscillator has gained momentum in 2023, indicating that we have moved away from a period where losses were dominant, which was only observed on 415 out of 4638 trading days (9%) during cycle lows.
The significant rebounds in unrealized profit occur mechanically when the price rises above a dense concentration of supply that was accumulated during the bottoming formation process (bottom left chart). This phenomenon can be quantified by examining the 100-day change in profitable supply following major cycle lows, both in terms of BTC and as a percentage of circulating supply:
- 2011 Cycle Low: +1.99M BTC (19.8%)
- 2015 Cycle Low: +4.94M BTC (32.2%)
- 2019 Cycle Low: +6.86M BTC (38.4%)
- 2022 Cycle Low: +4.87M BTC (25.5%)
The current cycle has witnessed a similar volume of supply re-entering a profitable position, indicating a robust support level. Although the aggregate value of profits realized is relatively small compared to the size of the asset, they are still significant in terms of USD and are equivalent to the 2019 rally to $14k.
Currently, there is mixed accumulation and distribution behavior across several wallet cohorts, indicating that the market is less decisive than it was during the first quarter of the year.
Originally Published on Medium
Email | Twitter | LinkedIn | StockTwits | Telegram | Newsletter






