
Macro models point to deep undervaluation, but chart signals suggest short-term risk. The question is which narrative will prevail.
Recently, Bitcoin’s price action has become a study in contrasts, one that pits macroeconomic valuation models against near-term technical signals. Two charts tell this complex story. The first, from Ecoinometrics, suggests that Bitcoin is trading at a remarkable 31% discount to its Nasdaq-implied fair value, which currently sits over $150k.
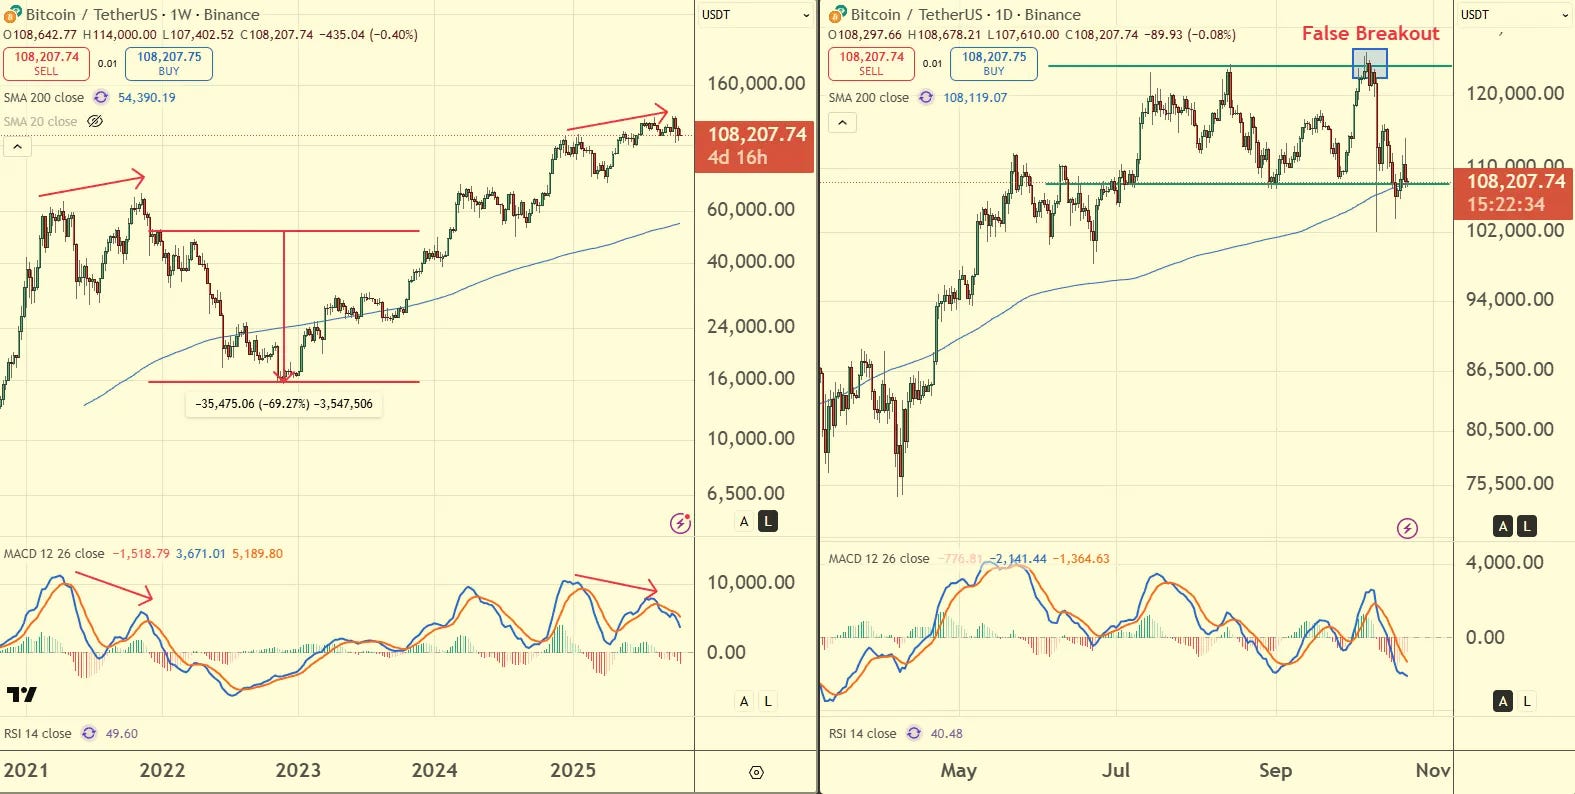
The second, drawn from Bitcoin’s weekly and daily charts, signals potential short-term weakness, with bearish divergences forming and a possible retest of key support levels looming. The coexistence of these two opposing narratives—macro undervaluation versus technical fragility—captures the crossroads at which the world’s premier digital asset now stands.
Bitcoin’s Nasdaq-Implied Fair Value: $156,000
Over the last five years, Bitcoin’s behavior has increasingly mirrored that of traditional risk assets, particularly the Nasdaq 100, the tech-heavy benchmark index on Wall Street. As institutional adoption deepens and Bitcoin is integrated into ETFs, retirement portfolios, and treasury reserves, its correlation with equities has strengthened.
Ecoinometrics applied a log-linear regression between Bitcoin’s price and the Nasdaq 100 index to determine whether the cryptocurrency is mispriced relative to equities. The result is striking: Bitcoin’s “model price”, that is, the level implied by its historical relationship with the Nasdaq 100, sits near $156,000. With Bitcoin currently trading around $110,000 (at the time of writing), the model implies that the asset is undervalued by roughly 30%.
That scale of mispricing hasn’t been seen since 2023, a period when Bitcoin’s price languished near $20,000 while risk assets began to recover from the post-pandemic tightening cycle. Historically, such large divergences have tended to close over time, often as Bitcoin rallies to “catch up” to equity valuations once macroeconomic conditions stabilize.
For long-term investors, this kind of gap represents what might be called “asymmetric opportunity.” When Bitcoin trades at a deep discount to its fair value while broader market risk appetite remains healthy, the probability of a favorable long-term outcome increases. It’s the sort of setup that value-oriented crypto investors and institutional allocators look for—especially in a maturing market where fundamentals and macro correlations matter more than speculative mania.

The Institutionalization of Bitcoin
This increasing alignment between Bitcoin and equities is no accident. Over the past five years, Bitcoin has undergone what many analysts describe as institutionalization. The introduction of spot Bitcoin ETFs in major markets, growing adoption among hedge funds, and the entry of sovereign players have collectively reshaped the market’s structure.
In the early years, Bitcoin traded largely in isolation, driven by retail speculation, hype cycles, and sentiment shifts. But as institutional demand grew, correlations with equity indices like the Nasdaq 100 strengthened. This convergence has two implications:
-
Bitcoin as a macro-sensitive asset: Its performance is now tied to liquidity cycles, interest-rate expectations, and risk-asset sentiment—much like tech stocks.
-
The rise of fair-value modeling: Analysts can now use cross-asset valuation techniques, such as the one Ecoinometrics employs, to assess whether Bitcoin is trading at a discount or a premium relative to traditional markets.
Viewed through this lens, Bitcoin at $110,000 appears cheap. Unless one believes that the bull market in equities, and by extension, in digital assets, is over, the odds favor a narrowing of the valuation gap.
The Technical Picture: Divergences and Range-Bound Friction
While the macro model offers a bullish argument, the technical picture (charts below) tells a more cautious story. The weekly chart of Bitcoin reveals a bearish divergence in the MACD indicator. The MACD—short for Moving Average Convergence Divergence—is a momentum oscillator that measures the strength of price trends.
When the MACD makes lower highs while the price makes higher highs, it signals that the underlying momentum is weakening. This is precisely the setup now emerging. A similar configuration appeared in late 2021, just before Bitcoin peaked near $69,000 and entered a prolonged bear market that wiped out more than 70% of its value. On the daily chart, Bitcoin has been trading within a sideways range between $108,000 and $124,000 since July.
This range has acted as a consolidation zone—an area where both buyers and sellers test their conviction. In early October 2025, Bitcoin briefly broke above the upper boundary of this range, surging past $124,000 in what initially looked like a breakout. However, the move quickly reversed, producing what traders call a false breakout or bull trap. False breakouts often signal that momentum has exhausted itself and that the market may be preparing for a deeper pullback.
Since then, Bitcoin has retreated toward $108,000, coinciding with its 200-day simple moving average (SMA)—a level widely watched by institutional traders as a long-term trend indicator. A decisive breakdown below this level would not only confirm weakness on the daily chart but also align with the bearish divergence on the weekly timeframe. Together, these signals could point to a more significant correction in the weeks ahead.
A Tale of Two Horizons
The divergence between the macro and technical outlooks is not unusual in Bitcoin’s history. Markets often oscillate between short-term overextensions and long-term undervaluation. The question is not whether Bitcoin is undervalued—many models suggest it is—but whether the current phase of consolidation will deepen before the next leg higher.
For short-term traders, the evidence leans toward caution. Momentum is fading, and key supports are being tested. For long-term investors, however, the data points to a potential opportunity. The 31% discount to Bitcoin’s Nasdaq-implied fair value could narrow significantly if risk appetite returns and macro conditions remain favorable.
Macro Context: Liquidity, Rates, and Sentiment
The next major driver for Bitcoin will likely be the Federal Reserve’s policy trajectory. Currently, markets have priced in two more rate cuts by the end of 2025, signaling a possible shift back to a more accommodative stance. Historically, Bitcoin has responded positively to such transitions—rising in anticipation of renewed liquidity in global markets.
At the same time, institutional participation through spot ETFs has helped dampen volatility. Bitcoin’s drawdowns are becoming shallower, and its recoveries faster, as passive investment flows create structural demand. The confluence of these factors suggests that the macro backdrop remains constructive, even if the near-term technicals flash warning signals.
The Investor’s Dilemma
For investors, this creates a classic dilemma: Do you buy the discount, or respect the technicals? The answer depends on your time horizon and risk tolerance. Those with a multi-year perspective may view this 31% discount as an opportunity akin to Bitcoin’s under-valuation phases in 2019 or 2023—periods that preceded large rallies.
For traders, however, ignoring the bearish divergence could prove costly if momentum weakens further and support at $108,000 gives way. In practice, many professional investors choose to scale in gradually, allocating incrementally during periods of technical weakness while keeping an eye on long-term valuation metrics. This balanced approach allows participation in potential upside without dismissing short-term risks.
Between Signal and Noise
Bitcoin’s current setup embodies the tension between valuation and sentiment, fundamentals and technicals, long-term potential and short-term caution. The Ecoinometrics model underscores a compelling macro undervaluation—one that aligns with Bitcoin’s growing institutional legitimacy and its correlation with the Nasdaq 100.
Yet, the charts remind us that markets move in waves, and corrections often precede the next advance. As Bitcoin hovers near $108,000, the next decisive move will likely determine whether this 30% discount marks a buying opportunity or a warning sign. For now, investors stand at the intersection of two truths: Bitcoin may be undervalued, but that doesn’t mean it can’t fall further first.
Originally Published on Substack.






