
[b]*SMC = Smart Monery Concepts. [/b]Please see the tutorials in the related ideas section for them as they contain a lot of information on how smart money works.
We have s 3 part a scenario in which I am already Long. There is a 15 min breaker in the current formation. It is pushing into it and I believe it will hget to the top of that breaker (Low, High, Lower Low the last grea cadle ine the High of the formation is the breaker. Generally it might might bounce under that breaker for a while accumulating orders making retail traders think it's going to drop as it creates multiple "Resistance points"
That Resistance will usually break, putting the price action into the breaker. The price will move to the top of the Breaker Block. Leave a somewhat equal High and then slightly pull back giving the illusion that it will drop it just had a lucky break. So Retail will short it again while smart money will buy it up.
Not even finished with the idea and the chart is doing that it takes a while to explain in detail why yo9u trade the you do, I don't slap numbers up there, I give the narrative)

https://www.tradingview.com/x/fledqqfO/
And as I'm finishing up the drop to the bottom of the box happened

https://www.tradingview.com/x/2eub431t/
...Darn I'm good lol
The the price action will cross the 15 min breaker Threshold and lets hope that by Noon EST U.S. that it closes above that breaker.
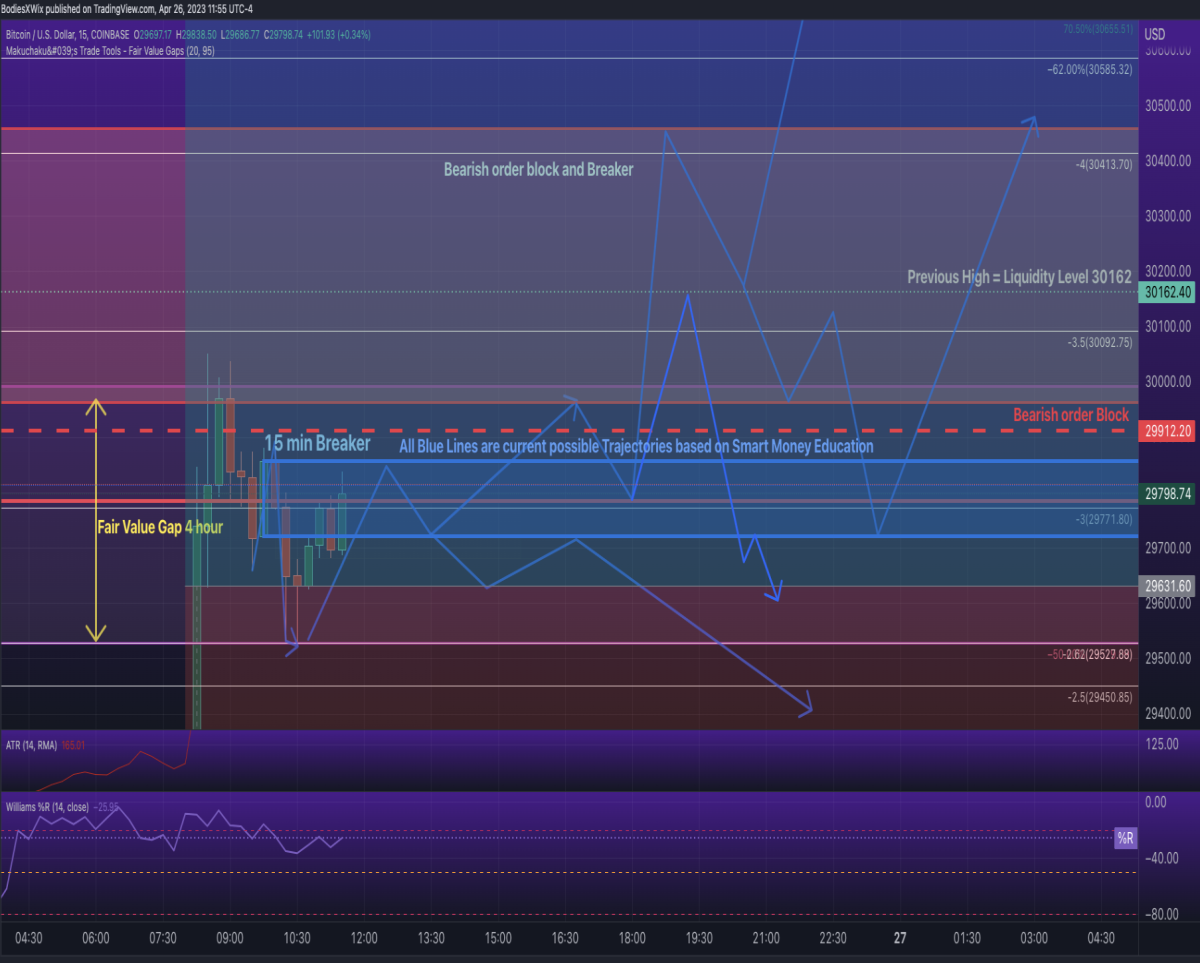
Currently in the breakear Here'sthe multiple scenarios as to what could happen; Paths are labeled in Blue Lines

https://www.tradingview.com/x/dIWmqsyv/
If it does close above it I'm looking at multiple levels to take profit. They are as follows
1. the median of the bearish order block that it had just entered [symbol="HKEX:29"]HKEX:29[/symbol],260. It could bounce down from there.
https://www.tradingview.com/x/Ms5Phtfv/
2. If it goes above look to take profit at the median of the order block [symbol="HKEX:29"]HKEX:29[/symbol],993
3. Lastly there is a 4 hour brearish order block that has already been struck by price action and I would aim for the top of that structure Near [symbol="HKEX:31"]HKEX:31[/symbol],041. This where a pool of Liquidity will lie
4. The ultimate aim for all of this is the Daily fair value gap that much higher above at 32645.49 to 33701.00 - Aim for the stars. Just be careful andf don't get rekt along the way
5. DON'T FORGET TO MOVE YOUR STOP LOSSES ONCE YOU'VE STARTED TAKING PROFITY
Faiur Valu Gaps are imbalandces that must be filled by price action going to the buy side sell
S/L - 27910.76 (If it gets loer I have a new entry at 29146 but I thjink it will get to the high first before the pull bacvk to that area, I USE THE RANGE of the current ATR to find my stop loss)
Take Profit - Short term goal - 31063.30 (And others in between - Take profit, add a position move you S/L - This should b like clock working )
Long term Goal - 33701.00 (Then geat ready for a large pull back
Entrance - Now or [symbol="HKEX:29619"]HKEX:29619[/symbol]
Personal Long term Trajectory in Yellow
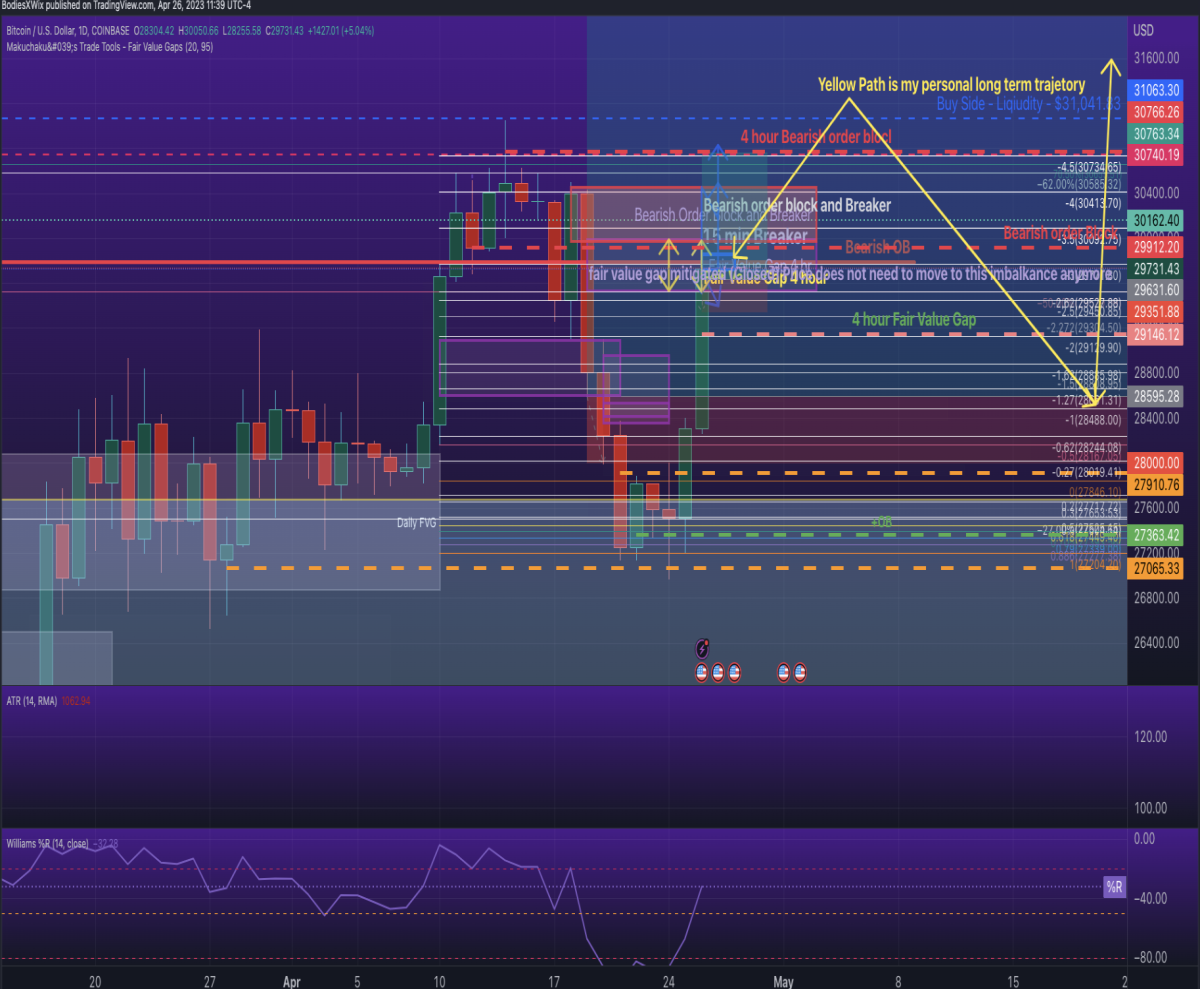
https://www.tradingview.com/x/WDQidslq/
Tell me your thoughts, what you think I may jnot be seeing that could help. I want constructive criticism
Cheers
[i]Bodies X Wix [/i]
(The name means a trading candle stick)
Related Smart Money Tutorials
Smart Money Tutorial - 1 of 2
Smart Money 2 of 2 - Manipulation Explained
P.S. After Enterig the long and typing this, I'm up 10% at 15x Leverage. That's high leverage for me so I really believe in this idea. Just saying
EDIT: After taking profit only once, I moved the stop loss to put me in a positive gain in case it went against me. It did indeed go the opposite direction I had thought. So the third option that was planned out in the original idea was the one that panmed out. I didn't expect such a dip though. Id did however, Get to the lower level I thought it would get to later first, It missed by about 400 which is a tiny amount in bitcoin at the moment, and the reasoning had to do with the the daily fair value gap shown here
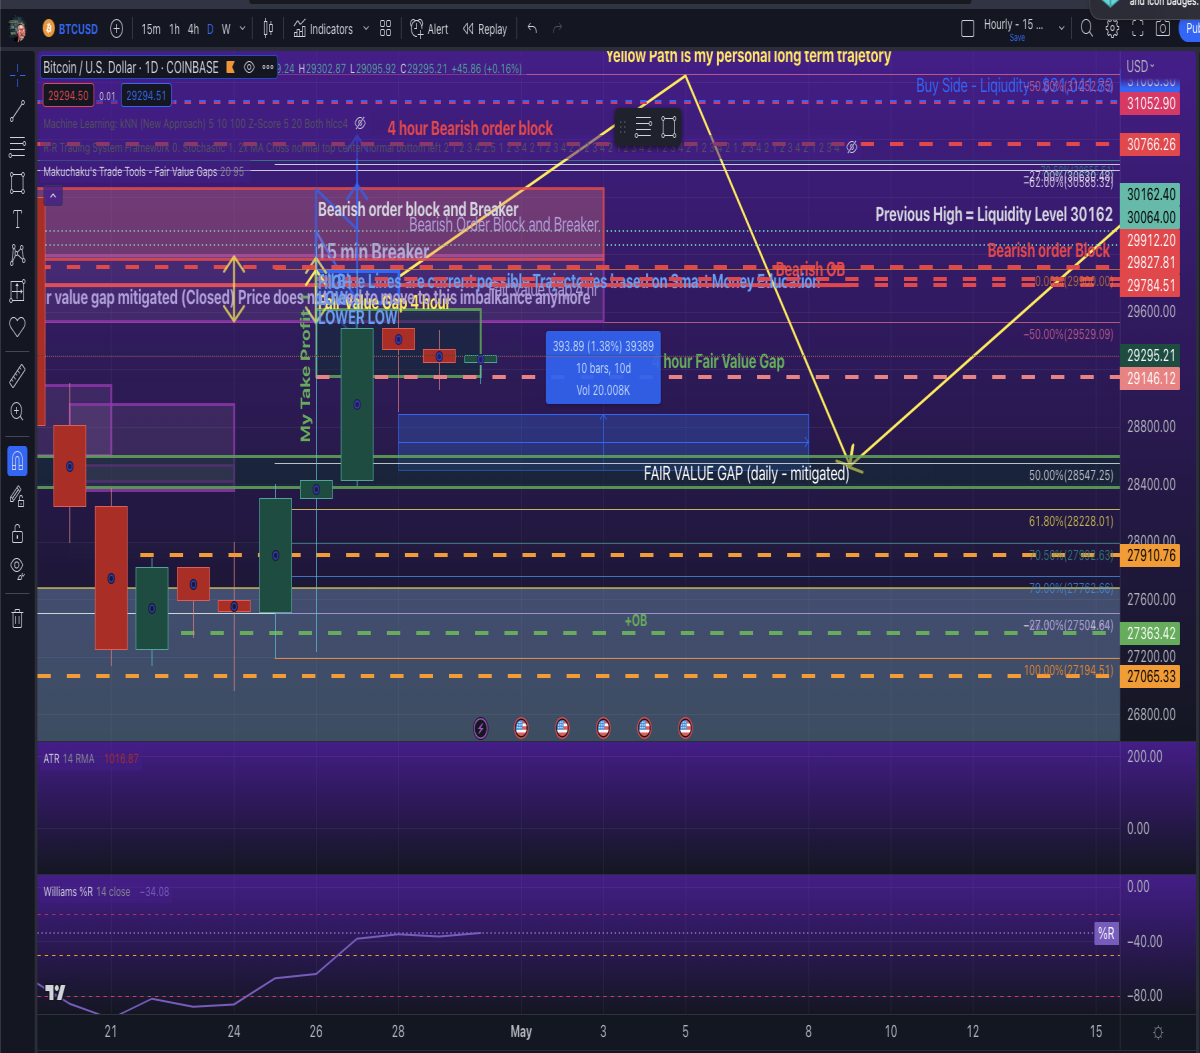
Even though price had touched both sides of the gap, the price is in Discount (50% or less) as currently it is not. We still could see some pull back. And we'll have to see how we end this week.
But now that it has made that dip it is my belief that it should the distribution will be to the to the buy-side liquidity once the manipulation stops.


