
Bitcoin broke down the support line that have been tested several times before, causing a dump in the whole market, affecting Bitcoin of approximately -11%. In today's article we are going to discuss the latest market moves, identify the support lines for BTC,ETH and XRP that are crucial in maintaining the uptrend. Please remember that this is not a financial advice, do your own research and trade wisely.
Bitcoin
After breaking the support line of 18375$, Bitcoin suffered from a 10% dump. Some analysts define this move as a correction before reaching ATH. It may be possible, but today we are going to talk about the next levels we have to keep an eye on.
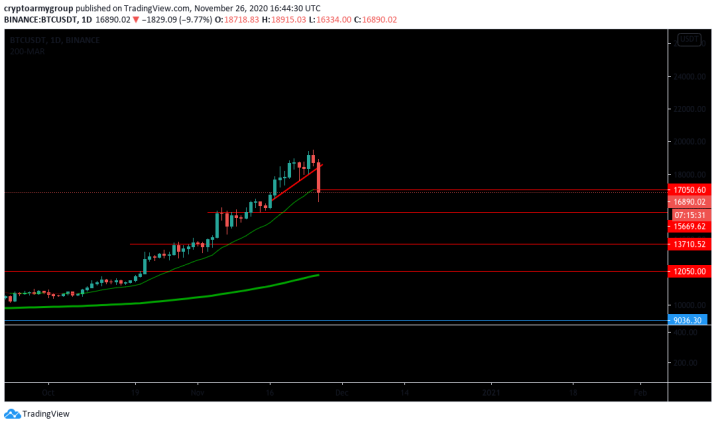
In the chart below, you can clearly see the previous trend-line being broken around 18375$. This trend-line have been tested for almost 4 points and held as a support line very strictly. After being broken, we have to look for further support lines on larger timeframe for Bitcoin. 
In the following chart we are going to identify easily the next support lines to keep an eye on. The first support line is the 20EMA on a daily timeframe. We should observe if today's candle can close above or below this level of 17050$. The second support line is 15669$, the third is 13710$ and the last will be the 200 EMA around 12050$.
These levels and mainly the last of around 12050$ are very important levels to hold. Falling below the 200 EMA on the daily timeframe will eventually lead to the reversal of the trend. As long as BTC trades above the 200 EMA we are in an uptrend. Bitcoin previously have suffered 4 intense corrections of almost 30%, if this occurs, we will be trading around 13400$.
Ethereum
Ethereum acted very similar to Bitcoin, following the move of Bitcoin and falling below after being trading around 600$. In the chart below you can identify 4 support lines. The first is around 502$, the secondly comes 487$. The third resistance line is the trend-line tested before around 408$. The last support is around 316$. The trend remains an uptrend for ETH. And the price will be severely affected by Bitcoin.
XRP
In our previous article analysing XRP. We identified 0.46-0.48$ as an important support area to hold because of the Fib retracement tools.
Falling below 0.46$ and closing the daily candle below this level means the reversal of the trend. The next support line will be the 20 EMA of XRP around 0.36 and the last support line will be the 200EMA around 0.28$
This was a brief view of the Top 3 Coins, in this article we discussed the important levels to keep an eye on. Please remember that this is not a financial advice, do your own research and trade wisely.
We would love to read your comments and thoughts, give us a like and follow us for the latest updates.
Thanks for your attention.
Crypto Army


