Bullish and bearish compression triangles are price chart patterns that indicate a period of uncertainty and consolidation in the market, usually before a strong trend breakout. Traders and technical analysts use these patterns to identify potential trading opportunities and to place stop loss and take profit orders.
Bullish Compression Triangle:
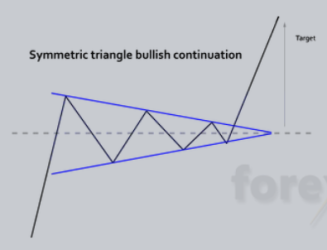
The bullish compression triangle is a price chart pattern that forms when an asset sees higher and higher lows and lower and lower highs, which meet to form a converging trend line. The bullish compression triangle indicates a period of consolidation in an uptrend, and it can potentially end in an uptrend breakout. Traders can place buy orders near the converging trend line and place stop losses below the lower trend line. Take profits can be placed near the higher trend line or at a key resistance level.
Bearish Compression Triangle:
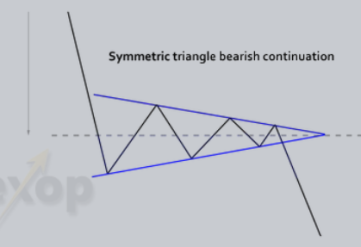
The Bearish Compression Triangle is a price chart pattern that forms when an asset sees lower and lower highs and higher and higher lows, which come together to form a converging trend line. The bearish compression triangle indicates a period of consolidation in a downtrend, and it can potentially end in a downtrend breakout. Traders can place sell orders near the converging trend line and place stop losses above the higher trend line. Take profits can be placed near the lower trend line or at a key support level.
Specific forms of compression triangles:
Bullish and bearish compression triangles can take several specific shapes, including:- Symmetrical triangle: a shape where the two converging trend lines are roughly equal.
- Ascending triangle: a shape where the lower trend line is sloping upward, indicating stronger buying pressure.
- Descending Triangle: a shape where the highest trend line slopes downward, indicating stronger selling pressure.
It is important to note that compression triangles can also be trend continuation patterns, rather than trend reversal patterns. Therefore, it is important to look at key support and resistance levels to determine if the triangle is likely to end in a trend break or a continuation of the current trend.
In conclusion, traders can use bullish and bearish compression triangles to identify potential trading opportunities by placing buy or sell orders near converging trend lines, stop losses below or above trend lines and take profits near key support or resistance levels. It is also important to watch the different shapes that triangles can take to determine buying or selling pressure and the potential direction of the trend break. Finally, it is recommended to use strict risk management, placing appropriate stop losses and take profits to limit potential losses and maximize gains.