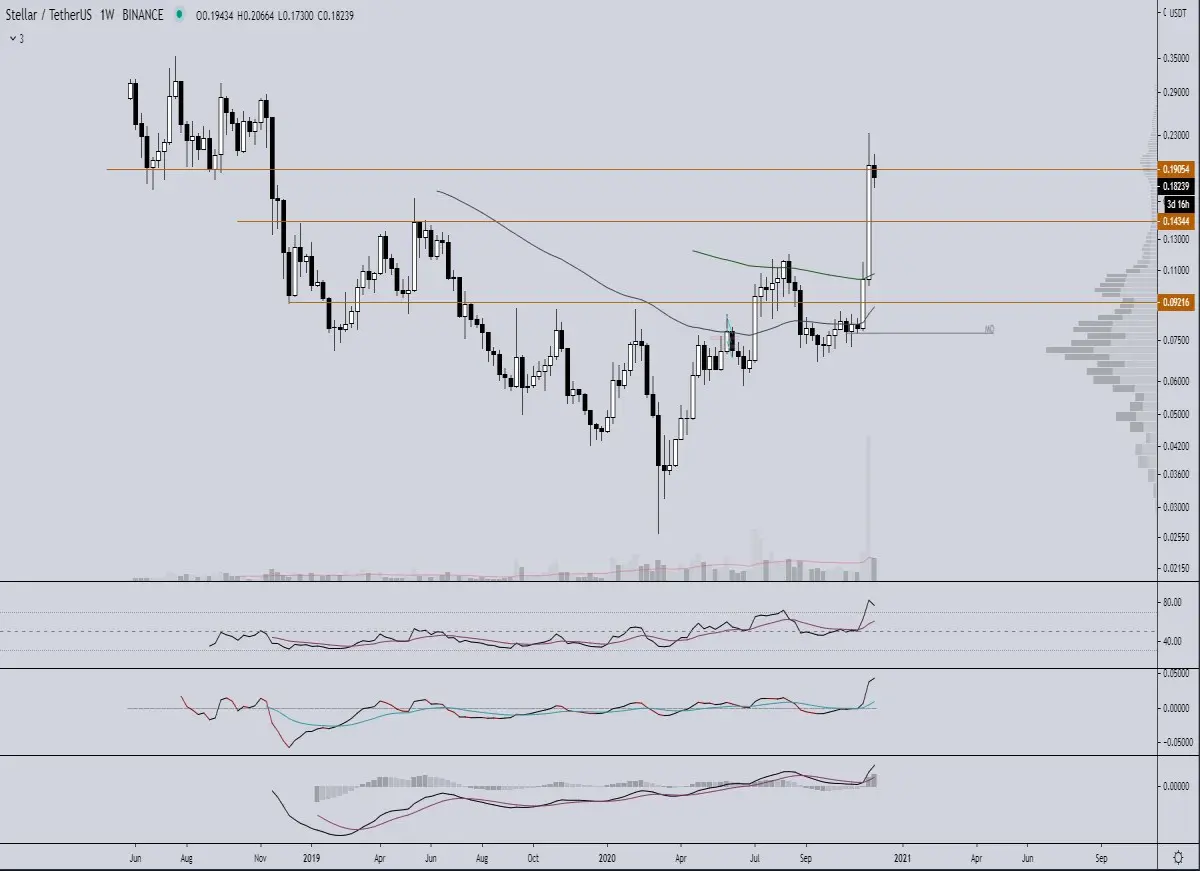
This week we analyze XLM for you. XLM has two nice weeks behind it in which three resistances have been broken and gains of 196% could have been achieved. Is it time to catch your breath or shoot the course through the roof. We're going to check it out on several timeframes.
➡️ Join our free crypto Discord server and come talk about crypto charts
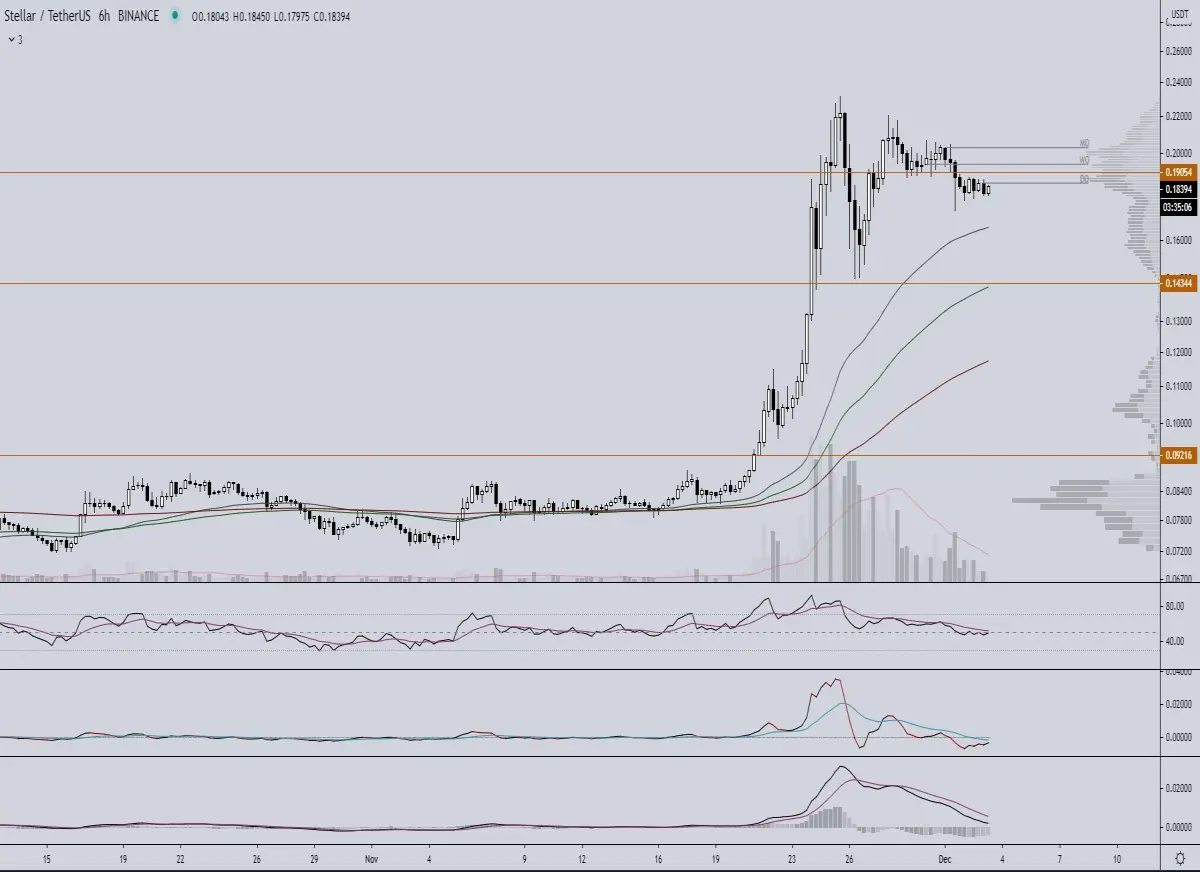
And we switch directly to the 6h graph because on the 1d and 12h there is too little information. At the top of the candles you can see a very nice trend line that functions as a resistor. At the same time we do not see a deep low which could indicate that compression is currently being built up for a move. From the peak of the price we see that the volume has also dropped drastically. This may correspond to the possible compression that is being built up. In a triangle, the decrease in volume is a good sign, unfortunately it is not an obvious triangle.
If we look at the rsi and lbr they are both at a point that when a crossover is going to take place it will happen at a beautiful point and the course may well pump further up. On the macd the bearish momentum slowly decreases.
Here we see a sideways movement in which the ema100 has provided constant support. The ema55 against this caused resistance and at the moment it is declining. On the indicators we also see a sideways movement in which all three of them are moving below the middle, the bears here have a very small advantage over the indicators. This sideways range is the range which we are going to have to keep an eye on today / tomorrow. 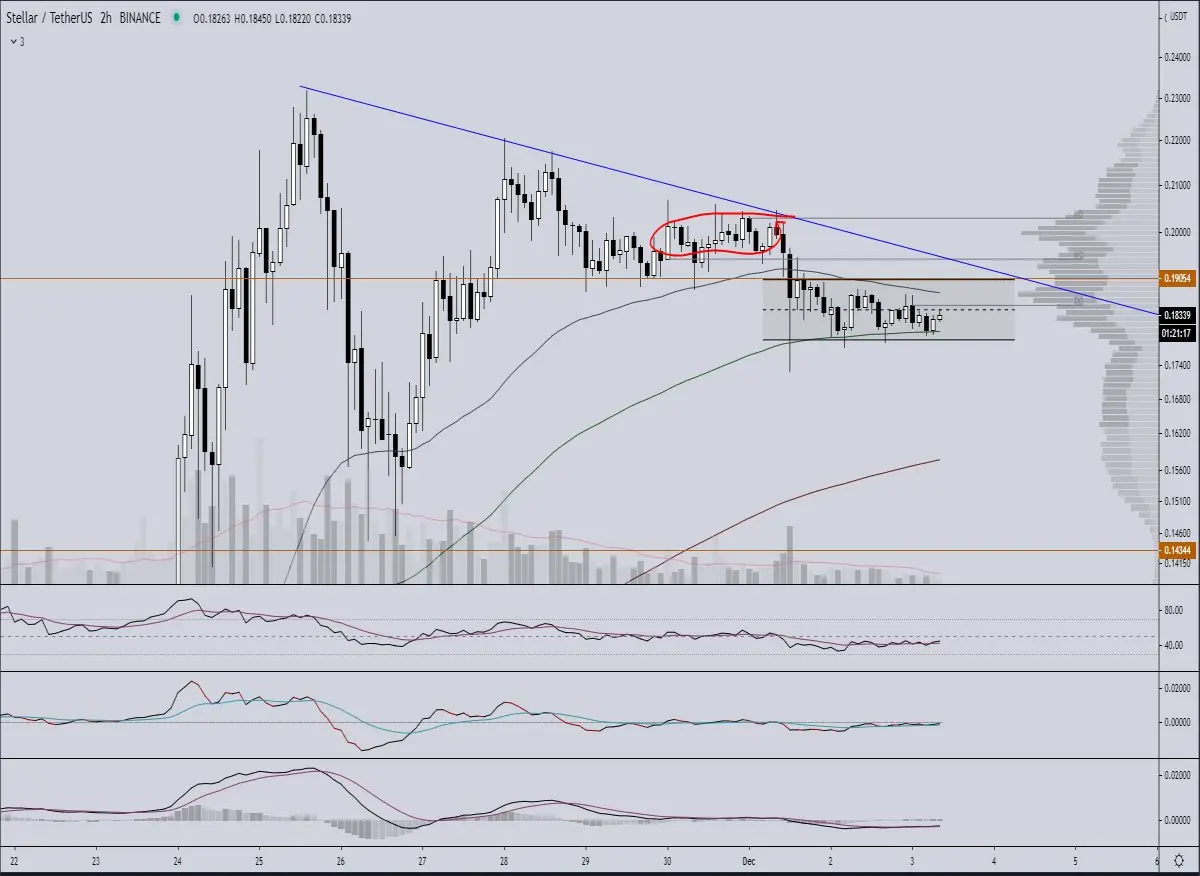
Conclusion:
It seems that XLM wants to go higher but personally I find it hard to say at the moment. To go higher, the price on the lower timeframes (1h - 4h) should close above the range and preferably above the highs circled in red. However, it is possible that on the higer timeframes a bull flag will form and the price may drop to the 12h golden pocket between 0.11615 - 012474.
➡️ Join our free crypto Discord server and come talk about crypto charts






