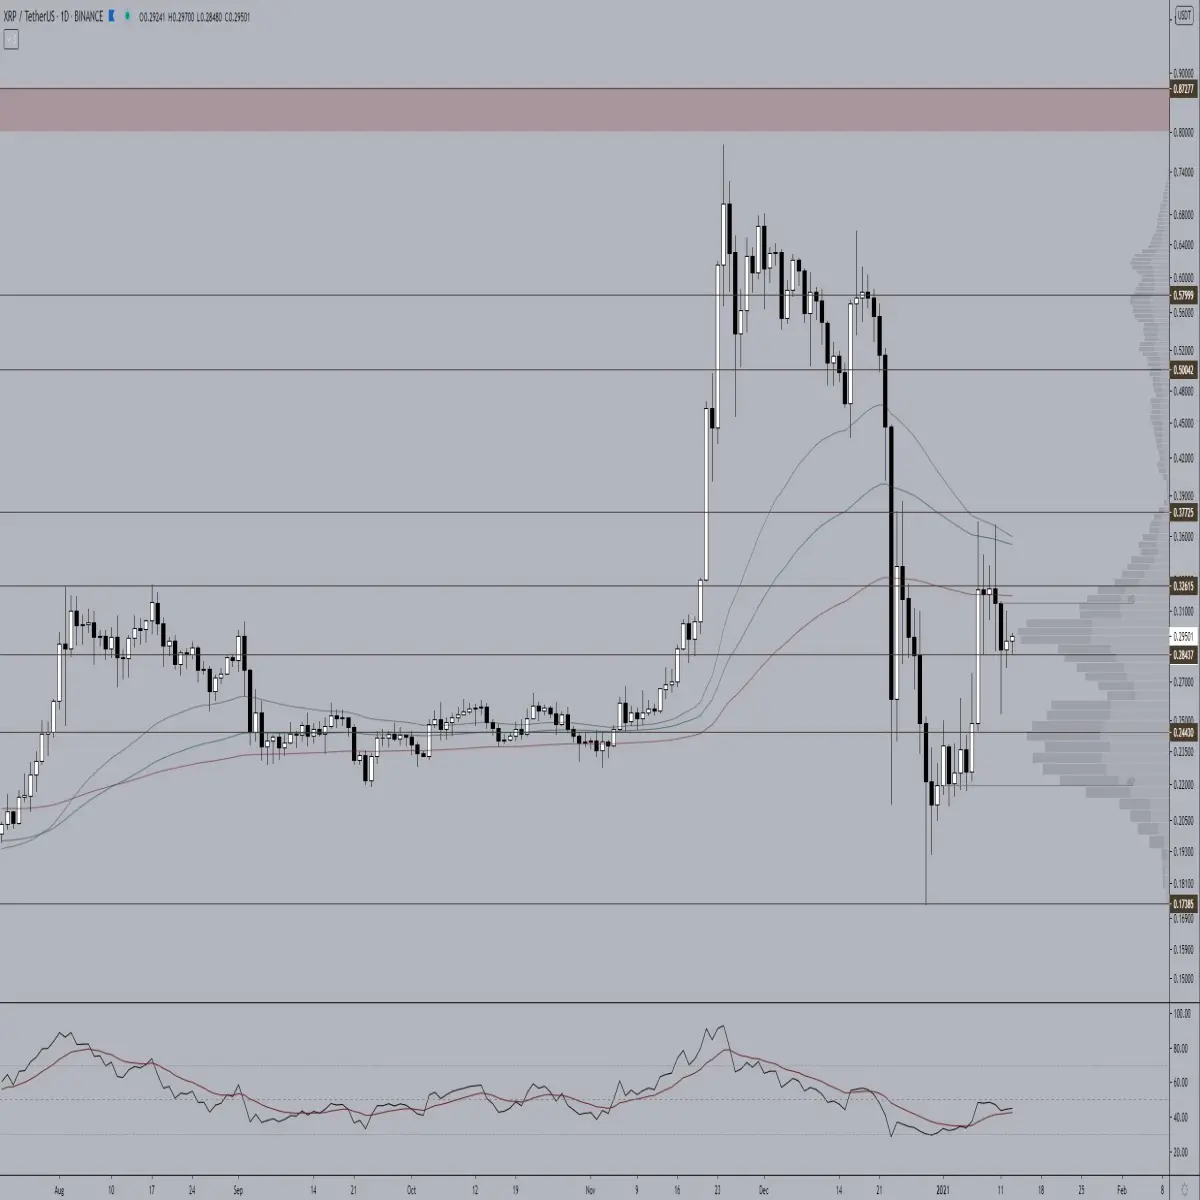
Ripple has managed to recover nicely after it collapsed following the news regarding XRP. After a 4h candle close above 24 cents, the price rose by 50% in one day to the resistance level around 37 cents.
Looking at the ema's they still indicate a bullish trend despite the drop. The ema200 does function as resistance and the ema55 is quite close to the ema100 and a bearish cross-over is one of the possibilities.
The rsi is also moving up steadily and manages to stay above the ema but is still encountering some resistance from the middle line on the scale.
After the breakout of the 24 cents, the price has reprojected onto the ema200. If we measure the ze wave with the Fibonacci retracement tool we see that there has been a beautiful back test on the golden pocket where the price now seems to be locked between the ema55 and the ema100 which by the way are in bearish mode.
The rsi has managed to create a higher low and is currently moving in a flat line together with the ema around the middle line. This could lead to fireworks both up and down but let's have a look at the 1 hour chart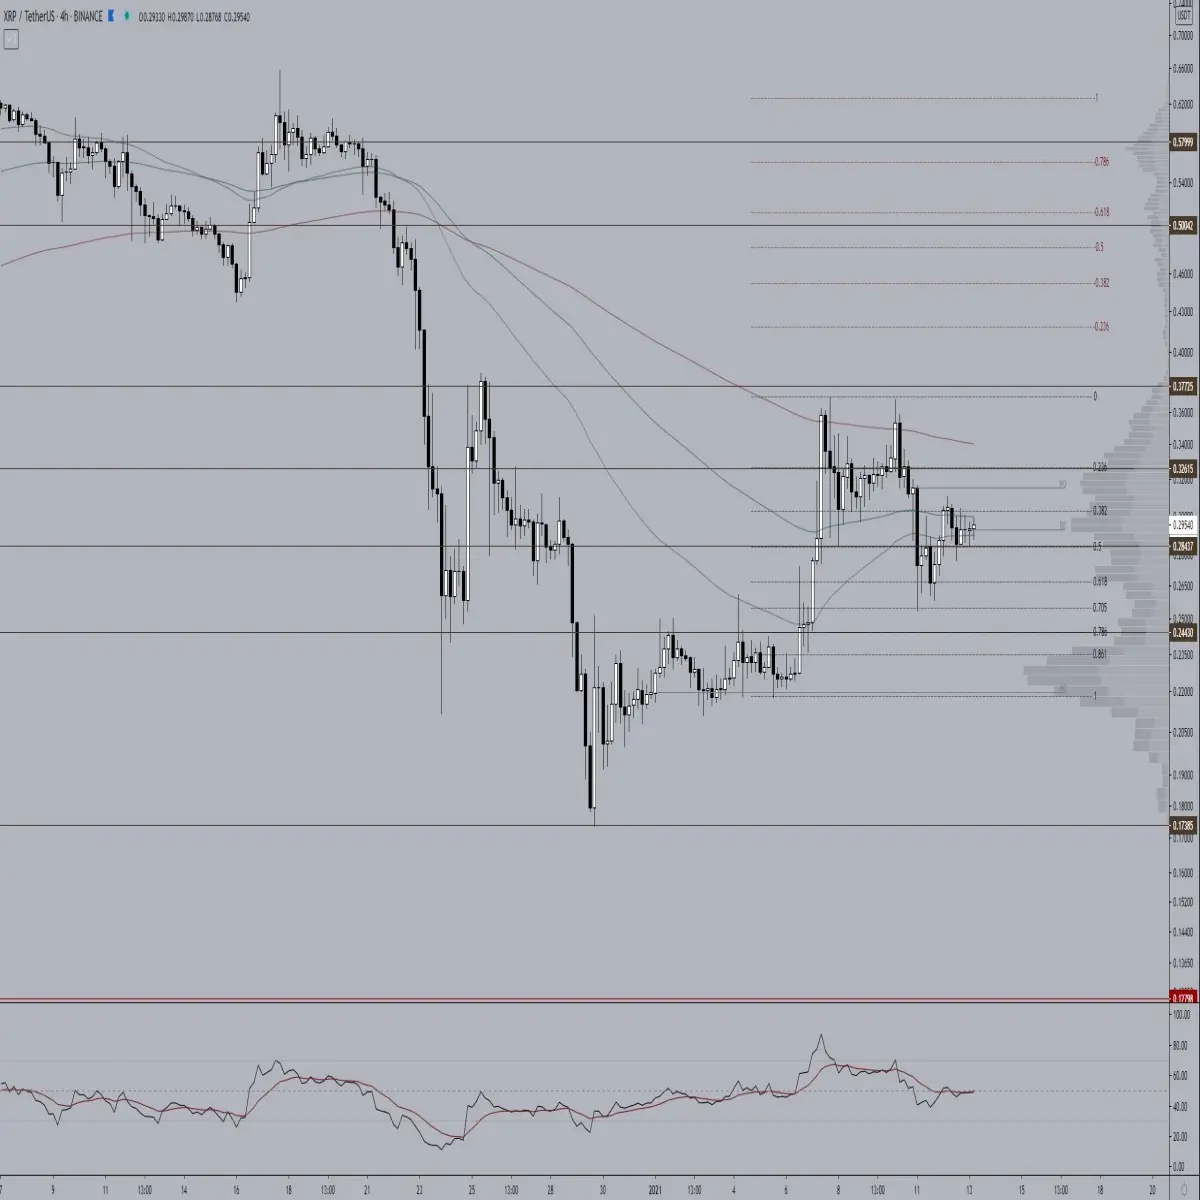
As in last week's analysis, traders can recognize two patterns in this. Namely a bear flag or a symmetric triangle. We also see the ema55 bearish compared to the ema100 which is still bullish compared to the ema200.
Here too we see the rsi moving sideways around the middle line. The rsi has already ginned up the ema here, which could lead to a rebound.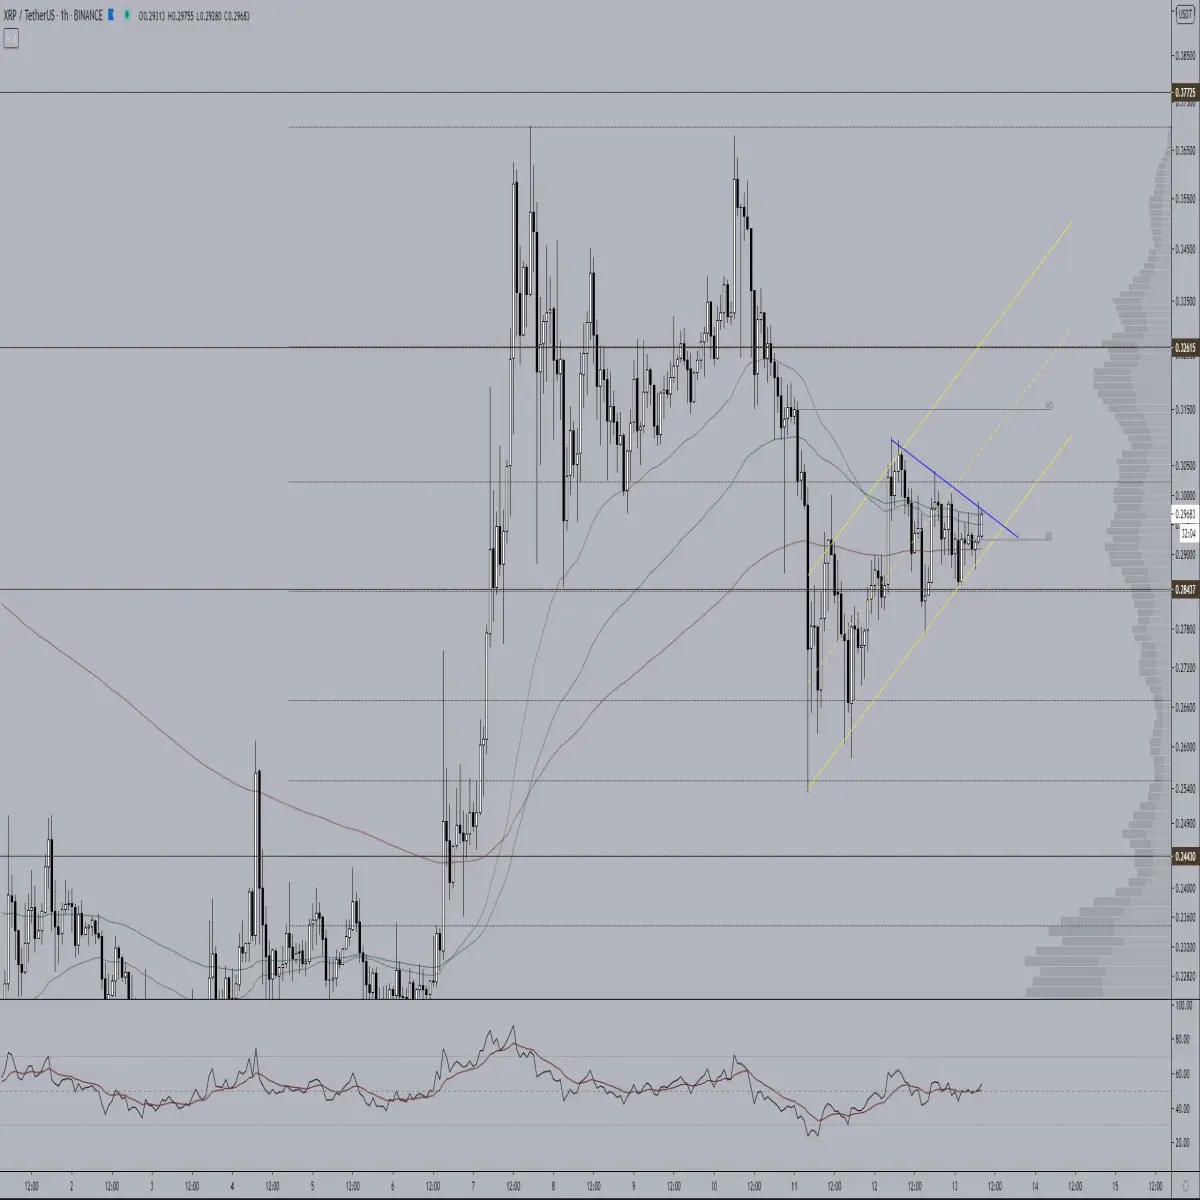
Conclusion:
The levels to start keeping an eye on are as follows. Support zones are located at 28 cents and 24 cents. Resistance can be expected at 30 cents and when the level flips to support I think we can start looking if we can claim the 33 cents.






