
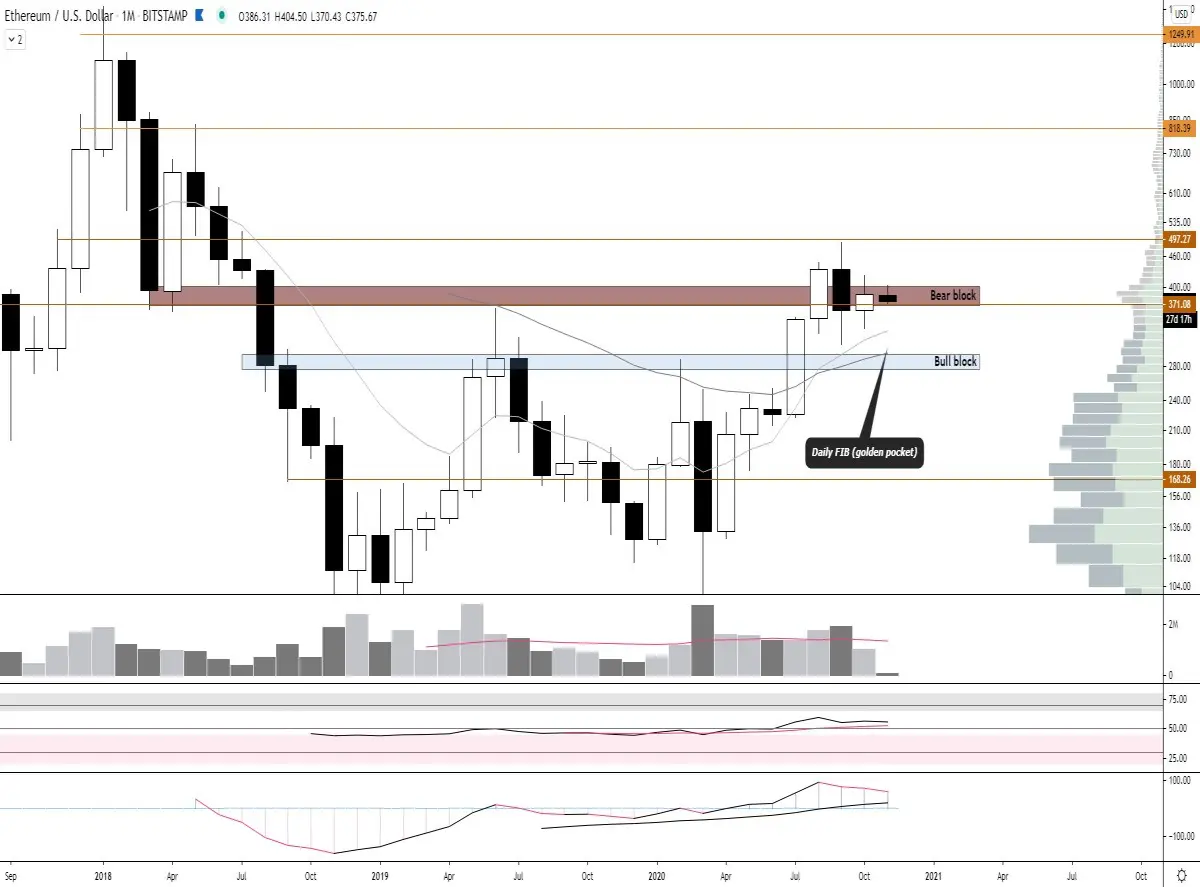
First we look at the monthly chart, here we see that ETH is closed above the $371 in the bear block. So next month we will have to figure out if we can get through or if we can go back to the blue support zone where there is also confluence with the daily/weekly golden pocket. The ema's are still going up and also on the LBR we still see bullish momentum enough for the longer term.
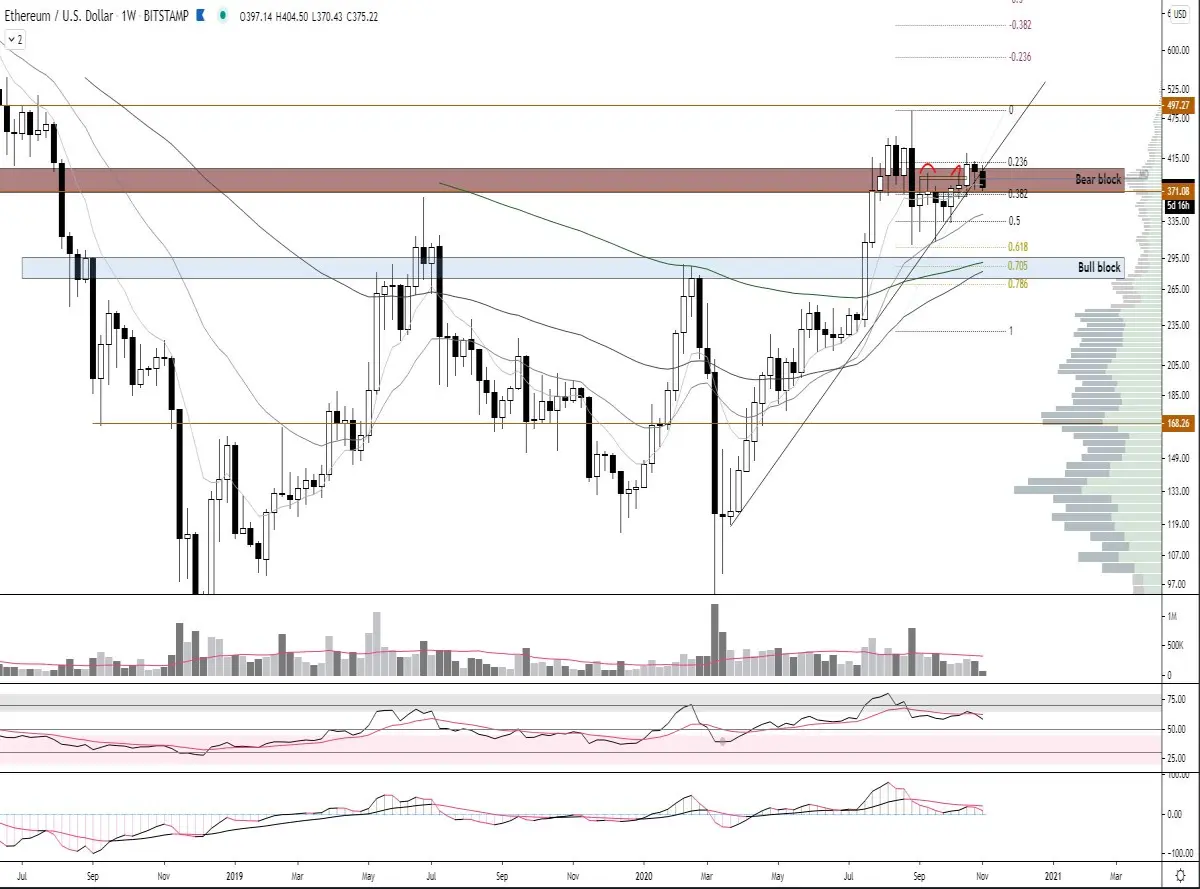
The week didn't start very well for the bulls. The uptrendline is broken at the bottom during the bearish retest on the bear block. The volume has also decreased visibly over the last few weeks. Although the ema's still seem to be quite bullish we see the opposite on the rsi and lbr. On both we see the bearish rejection on which both went down to the middle line. The bit of bullish momentum we see is decreasing and the uptrend seems to be cooling down for the time being.
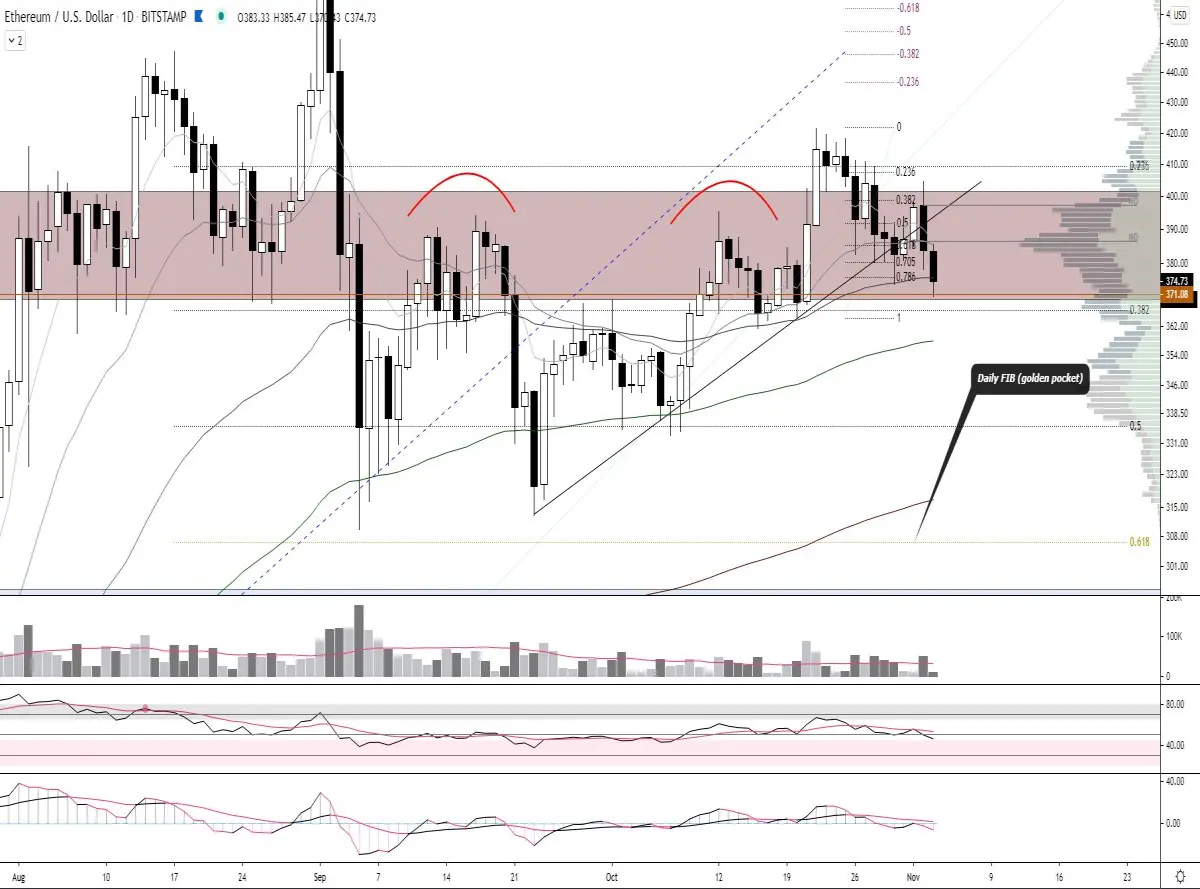
After breaking the highs, the expected retrace was to the golden pocket. However, the bulls (so far) were not strong enough to pull the course further up. As we mentioned before, this is a tough zone to break, and that shows again. The two short ema's seem to make a bearish crossover today, the longterm ema's are still in favor of the bulls where the ema55 should now serve as support. If today's candlelight closes below that, we'll have to watch out for a lower low. The rsi and lbr both dive into the bearish part and we win the bearish momentum.
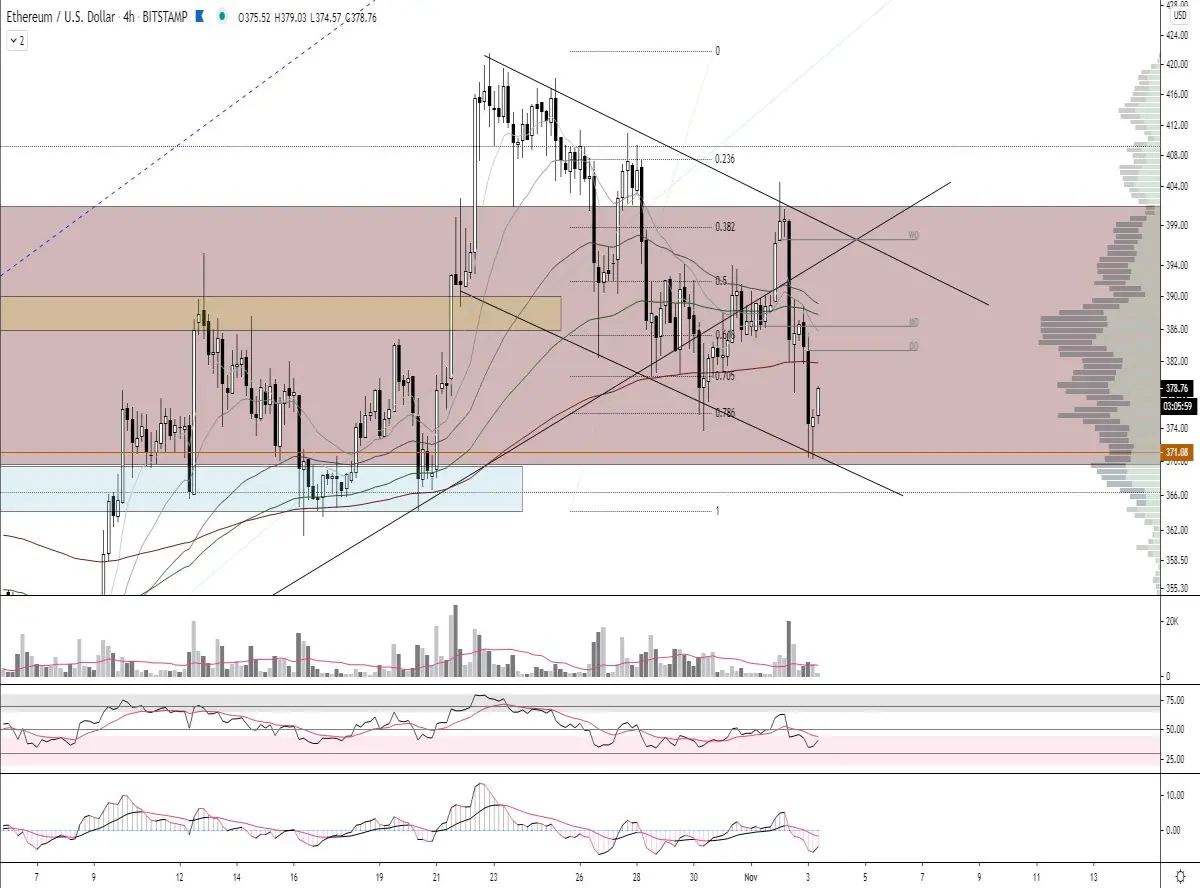
On the 4 hour graph ETH is at the point of do or die. We hang on the HTF support level while on LTF we constantly set a lower low and lower high, creating a down channel. The ema's are not very favorable for a price increase. The price is below the ema's and will most likely be resisted by the ema200 (red) which is open just below the daily and monthly. The rsi is below a falling ema in the bearish area. The lbr shows the same and we also see that there is quite some bearish momentum.
Conclusion:
I expect that we can see an increase to the daily and monthly open 383 - 386 dollars. This is an important point for ETH. A bearish retest will most likely result in a drop towards $335 - 340. In theory, we could set a higer low on the HTF above that. If we slip the $386 to support then the next resistance of the channel's trend line is $396 - 400. Only when we have been able to convert that to support on HTF we can expect more action.
➡️ Join our free crypto Discord server and come talk about crypto charts
➡️ Get free lifetime access to our margin VIP room by making account on Bybit using this link and deposit 0.05BTC or more. Sent me your UID in our Discord channel or by a DM
➡️ Get $50 free when you ordered a crypto visa card from crypto.com using this link. (reff code: mk9r332rp2)






