
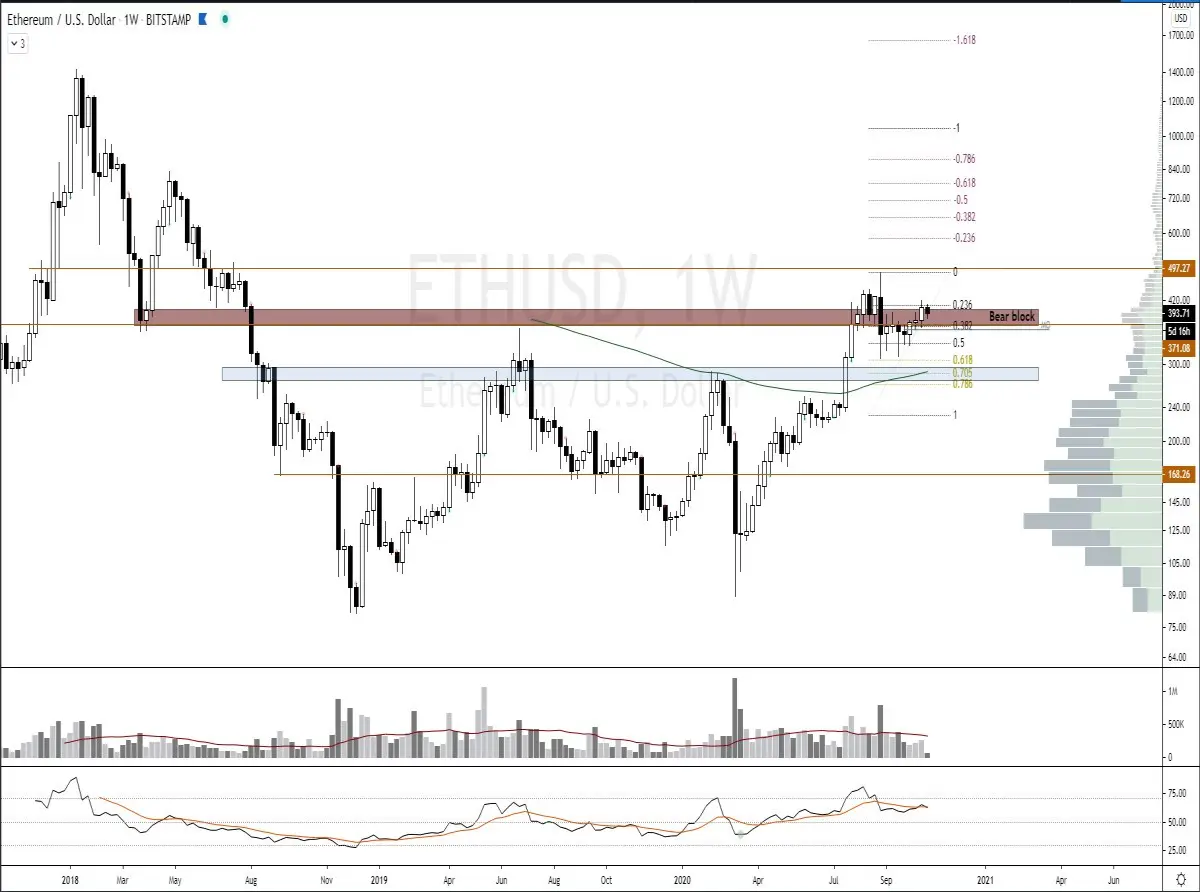
Where BTC showed a nice increase last week, ETH has taken it slower. There has been a candle close above the bear blocks last week and still a higher high is needed to confirm the uptrend. The ema's are rising steadily and in general the rsi is doing the same. Although we are seeing a small dip at the moment. Can we continue the uptrend? Let's take a look at the lower timeframes.
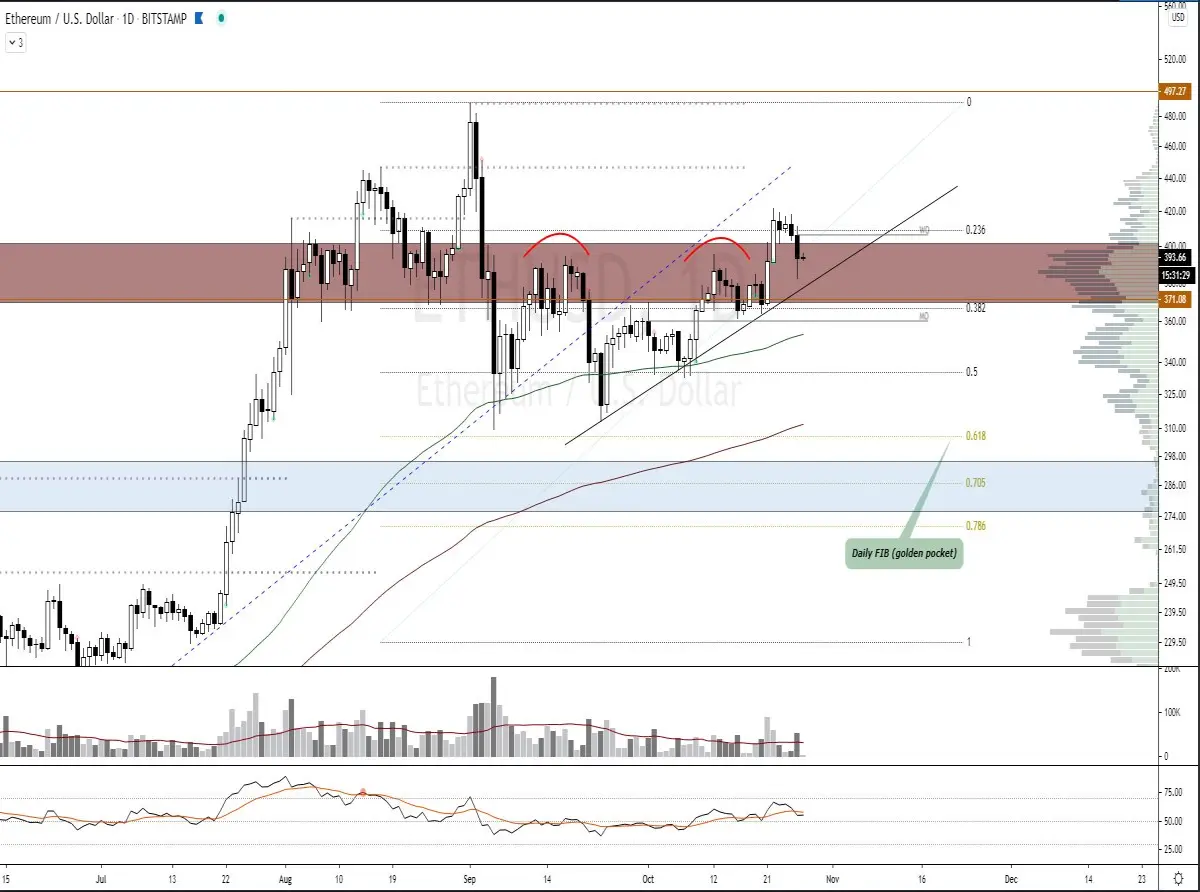
On the daily we had a break of the same highs marked with the red bow. The higher high that has been put down is strong and for me a good confirmation on a progression of the steigin. We see that the black uptrend line is constantly appreciated. Looking at the indicators we can be pretty positive. The ema's are beautiful and also the rsi is rising steadily. However, there is a lack of volume, when it shoots in, the course of ETH can quickly go to the next resistance level. When we put the fibonacci on the last inpulse wave, yesterday the fibonacci level 0.618 is kicked. This level is a very common level on which isounced.
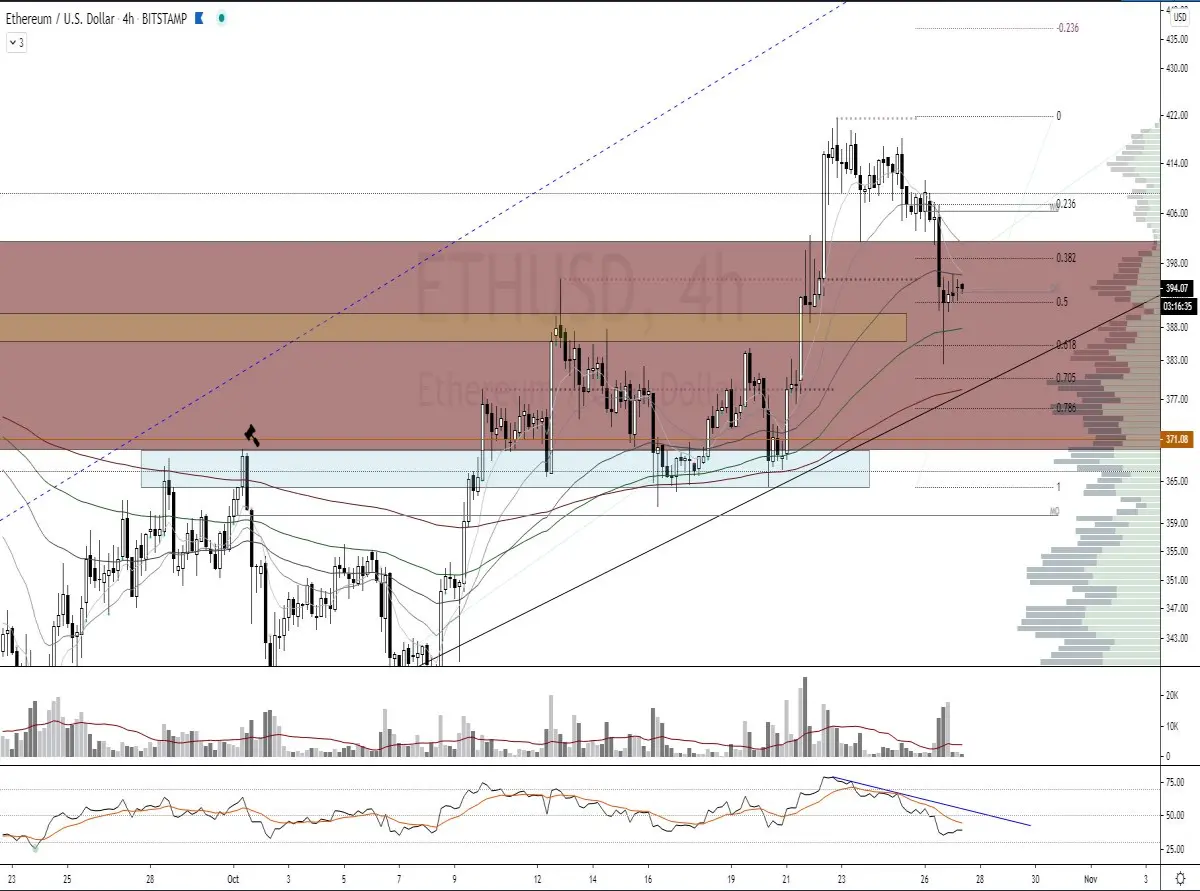
On the 4h chart we can clearly see the wick on the fibonacci level. In this 4h candle we can clearly see that the bulls have done their best to get the price up. This bounce on the fibonacci level had confluence with the yellow resistance zone which seems to have successfully flipped to support. We see the two short ema's (8/21) are bearish and the three longer ema's (55, 100 & 200) are in bull mode with the ema55 currently functioning as a resistor. The rsi has decreased significantly in the last few days and has been experiencing resistance from the ema all this time. The rsi seems to be going up at the moment and the ema is going down, will the bull crossover finally come? It would be nice, especially if the blue trend line will be flipped as well. But this requires volume. For a moment it seemed to be finally there but that was for a short time because it immediately went down again. Even below the level before.
Conclusion:
I'm still cautiously bullish because as you've read there is some resistance. As long as 380 - 390 dollars can stand as support, so no 4h or higher timeframe candle close underneath I give the advantage to the bulls.Targets for the bull side are still around 440 dollars. However if we lose the 380 - 390 limit we will soon drop back to the 360 dollar limit, I prefer not to see this happen as that level has already been tested and a new test would make it weaker.
➡️ Join our free crypto Discord server and come talk about crypto charts
➡️ Get free lifetime access to our margin VIP room by making account on Bybit using this link and deposit 0.05BTC or more. Sent me your UID in our Discord channel or by a DM
➡️ Get $50 free when you ordered a crypto visa card from crypto.com using this link. (reff code: mk9r332rp2)






