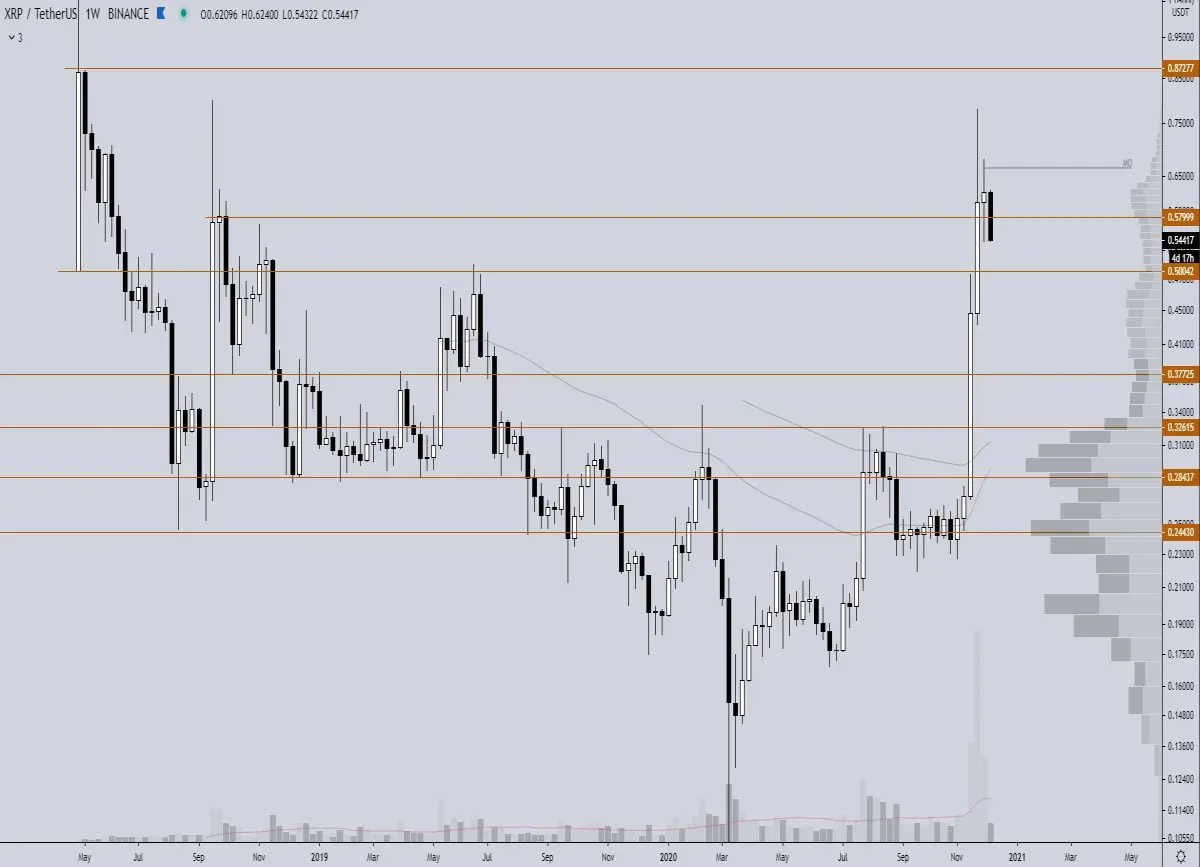
Last week's candle close shows an indecision candle with a bearish week candle behind it. The retrace is in progress, we can say how far it will go, we should take a look at the lower timeframes. On the week chart the first support level is $0.50 and below that the next support level on the week chart is $0.37725 which is about 25% lower.
Daily we clearly see a down trend line that is respected. If today closes like this we also have 3 black soldiers (candlestick pattern) which is beneficial for the bears. The ema's are bullish but lose momentum. After the price has crossed the ema's they haven't been tested again and with the current findings I expect that one of these days will happen.
The rsi encounters quite some resistance from the ema but so far has managed to stay in the middle line. The lbr is descending a bit harder and has already crossed the middle line bearishly and the bearish momentum is increasing which we also see again on the macd. The macd has also had a bearish crossover but is still in bullish terrain.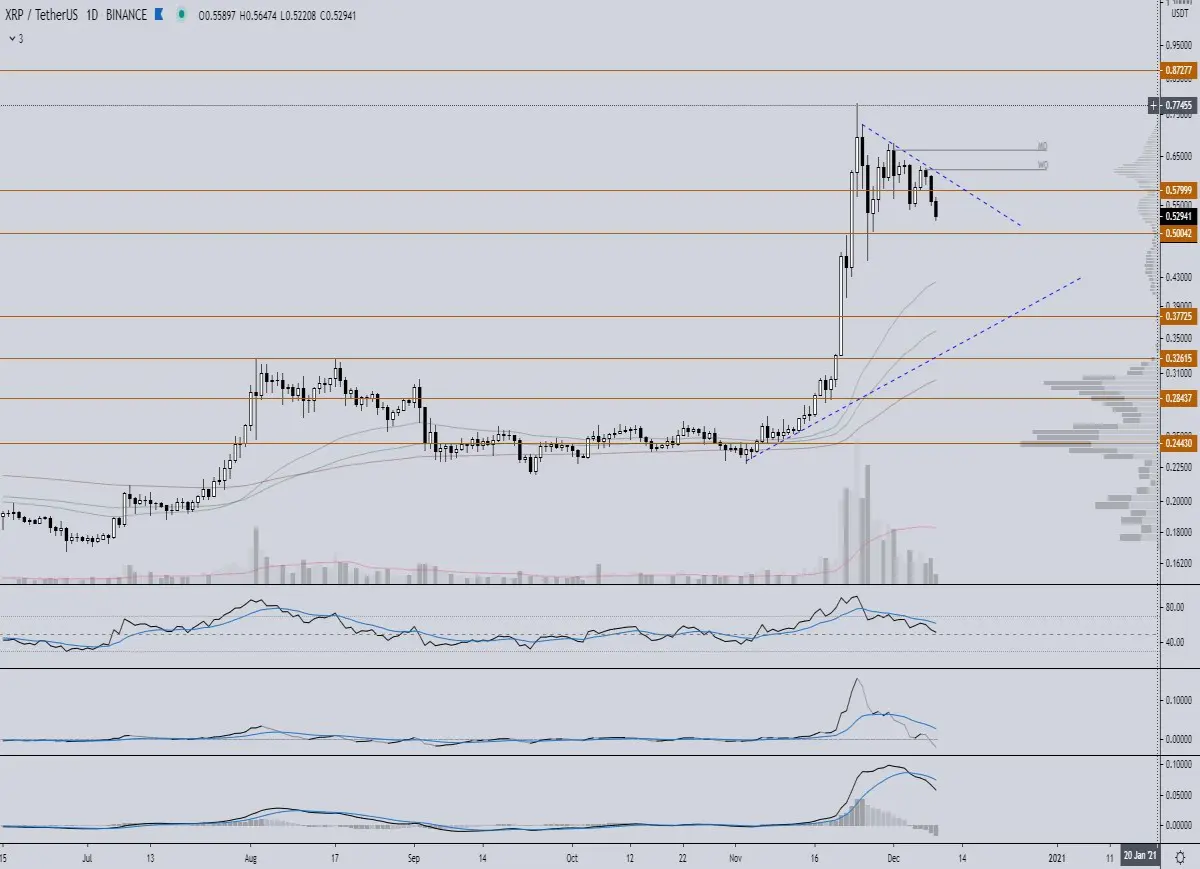
Although it was a beautiful triangle that we sketched last week with decreasing volume and a 70% chance of striking it has not been able to play. After the outbreak at the bottom we also immediately crossed the horizontal line with a back test on the upper trend line and then lowered further.
This is a good example of why I personally prefer to trade the horizontal levels rather than patterns. Horizontal levels are just much more reliable and stronger. It doesn't stop me from drawing them in because when there is a lot of confluence with other signals you can assume it is a strong signal.
We see the ema200 is just under $0.50 which could provide support. However the ema55 is fast descending towards the ema100 which is not favorable for the bulls when crossovered. The rsi is quite oversold but that doesn't mean the drop is over. The rsi can be there for hours/days.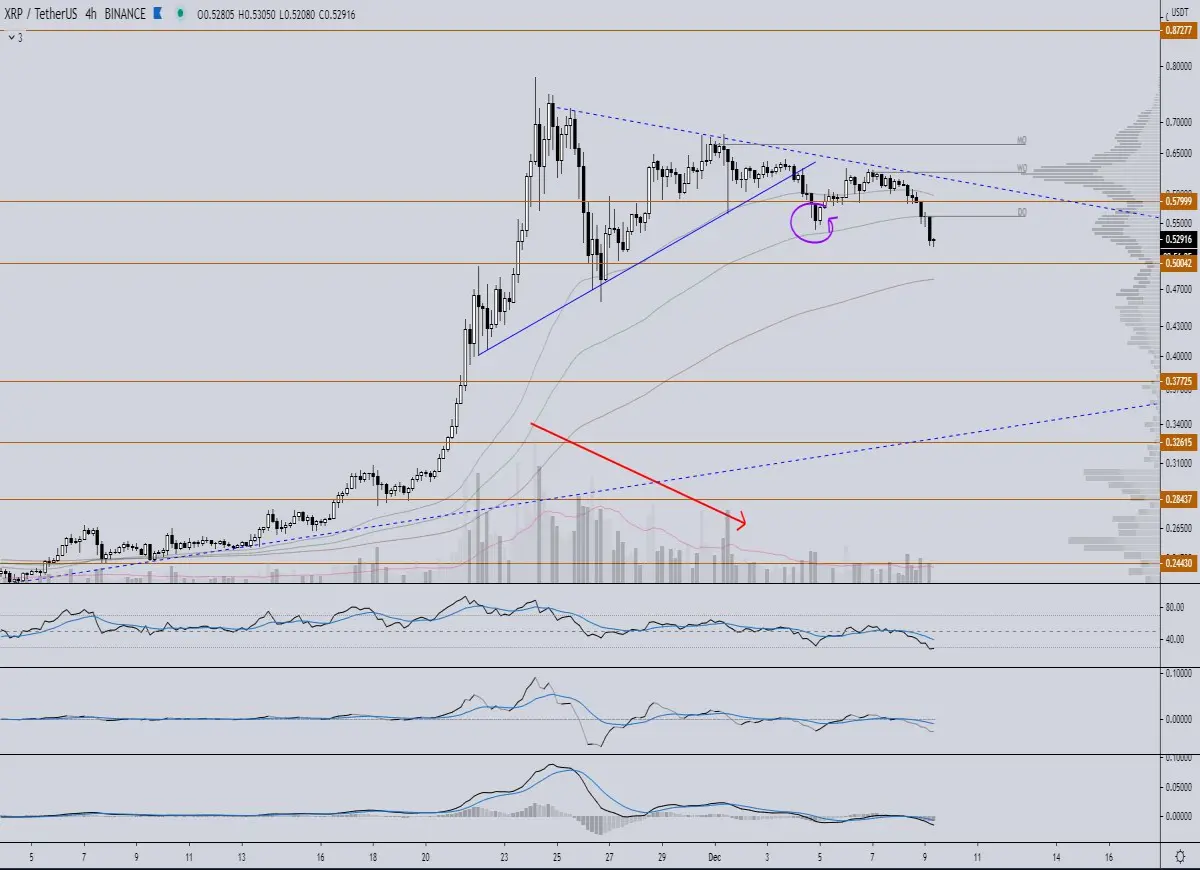
Conclusion:
The $0.50 is going to be visited in sws and from there we need to see if this was it or not. Personally, I think we can drop a little further down to the $0.45. Close the daily below here then we need to take a serious look at the 0.37 level where there is also confluence with daily golden pocket. Despite the fact that it is the best drop to the $0.37 level, the long term price remains bullish. A low at that level would mean a higer low.
➡️ Join our free crypto Discord server and come talk about crypto charts






