Last week a hanging man against resistance of the ATH was put on. Are we going to see the expected retrace or are the bulls still stronger and a new ATH is coming. This week we will take you through several timeframes to see the possibilities.
The indicators are all bending down a bit but not yet something we need to worry about right away. As long as we close the 11684 - 12539 on the weekly above, Bitcoin imo bullish for longterm.
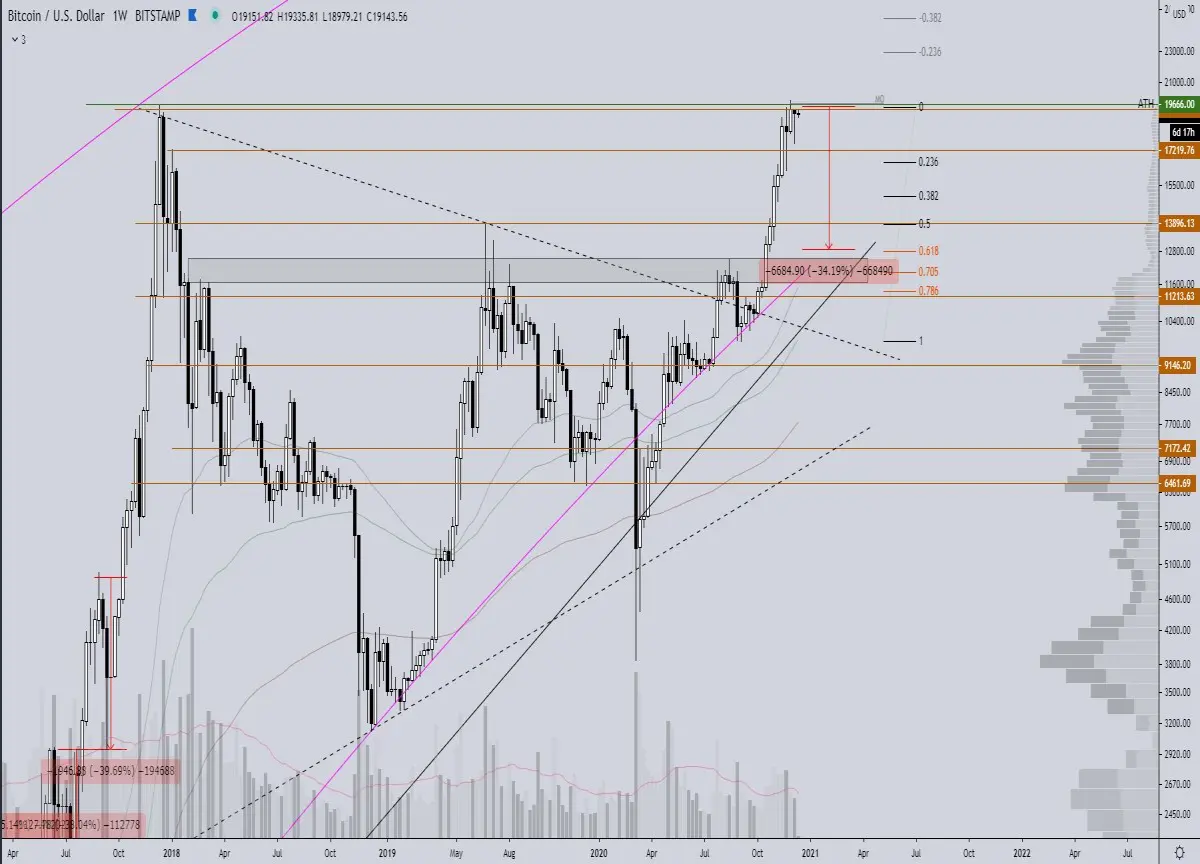
Here we see a sideways movement as mentioned last week in an outbreak at the bottom of the triangle that we will see later on the 4h chart. After setting a higer high we can now also say that there is a higher low.
The bear div resistance line has already been broken through by the rsi and lbr at the top. This is often a first indication that the price is going to move upwards. I still have the red div line on the chart as it could become a potential resistance.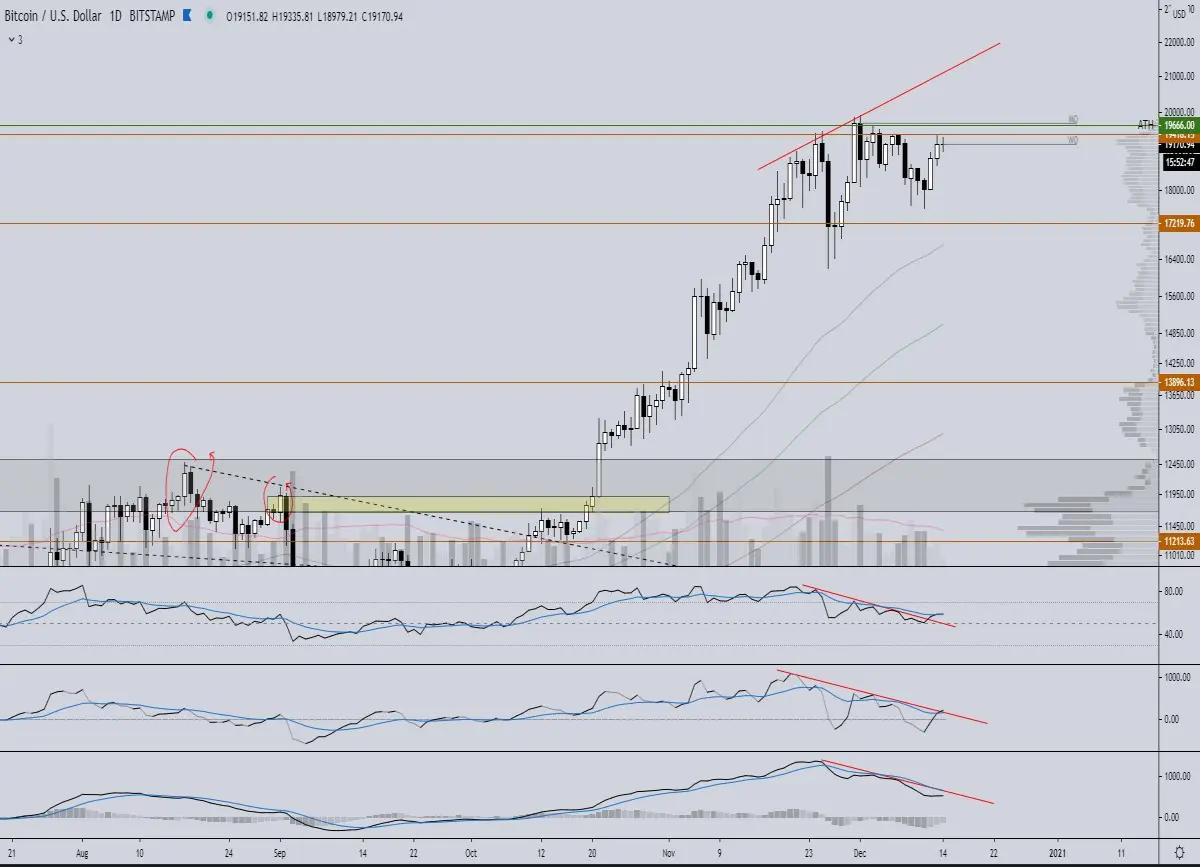
After the triangle broke, the price dropped to the 17569 (slightly lower than I expected) where it was nicely collected around the ema200. This allows w and u to place an uptrend line and together with the bear div line this can form a rising wedge. I keep this in mind but as you probably already know I prefer to trade the horizontal zones myself.
At the 4h there is not much happening at the moment, it seems to want to catch my breath for a while. We also see this on the indicators. The rsi is currently bouncing from the ema which is a bullish sign.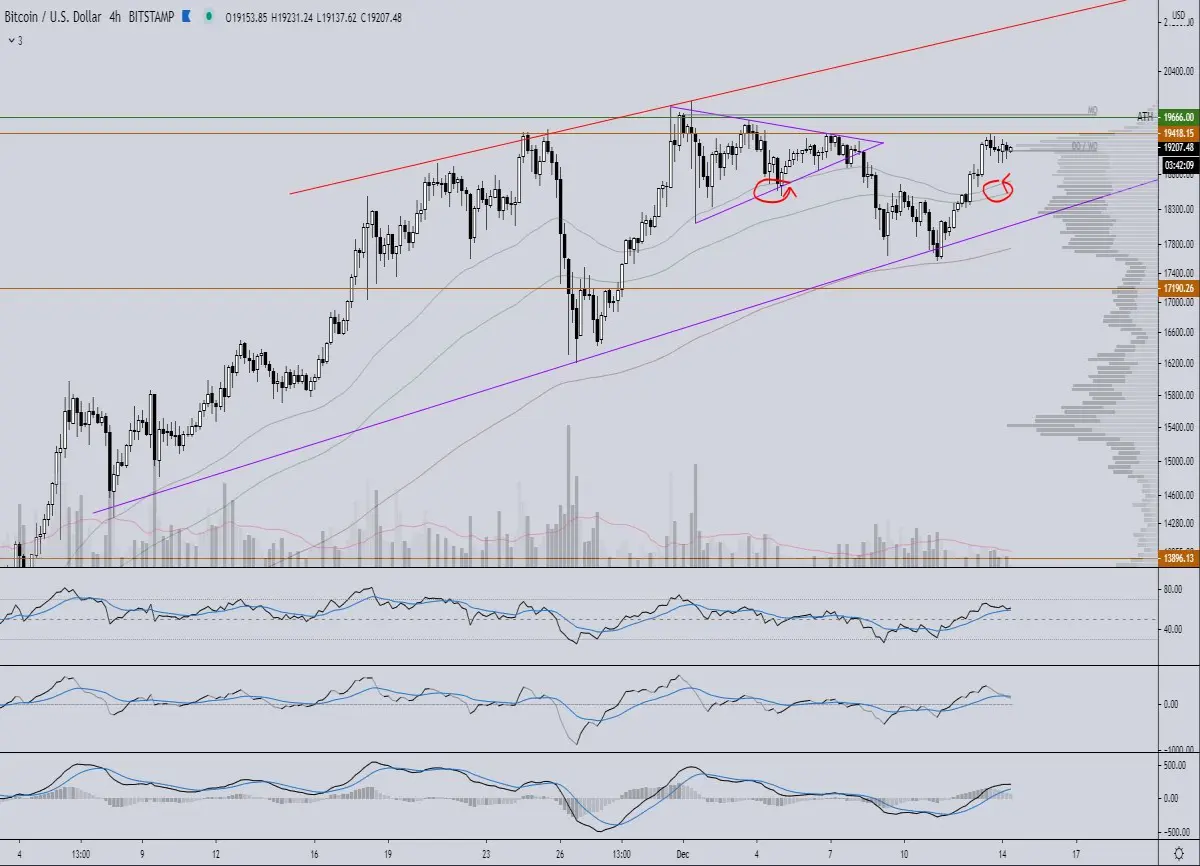
This week we will also take a look at the 1h graph because we spotted a nice bull flag here where the ema's before it also had a bul;lish cross-over. The rsi has put a double bottom (yes trend lines also work on indicators) on the 50 line but is still experiencing resistance from the ema. The lbr has a higher low in oversold and is already testing the ema.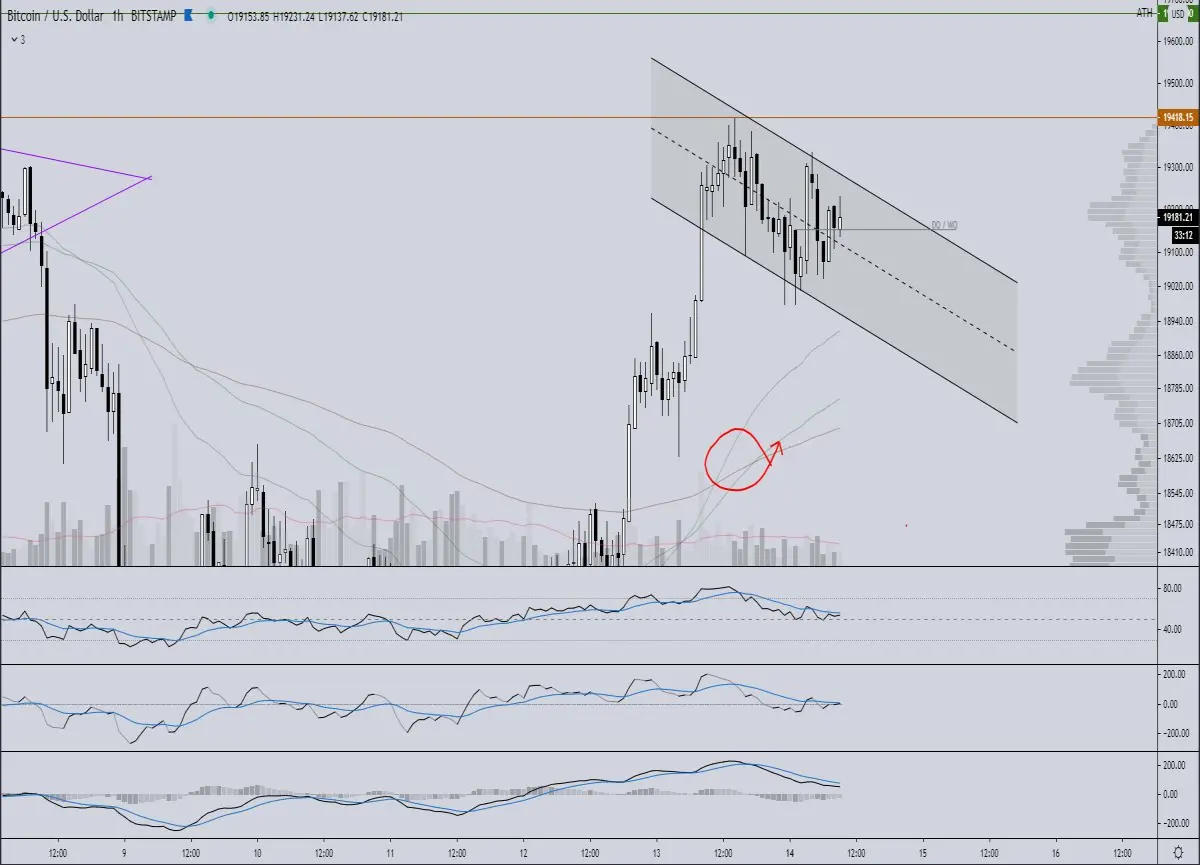
Conclusion:
Longterm still bullish but that wouldn't be a surprise. As long as we stay weekly above 11684 - 12529 I think we can be bullish on Bitcoin. Of course, there is no guarantee that we will actually go that low. On the daily and lower for example, the bullflag can still play. Before that the course could drop to 18.7 - 18.8 where confluence with the previous highs and the ema's are. When the bull flag plays out BTC should be able to go to the 21K where there is also confluence with the bear div trend line.
What do you think we will see in the coming week / month? Do you agree with the above analysis? Also If you like this content, consider tipping the article and following me, so more people see this content and we can make money together.
Also, If you are interested in trading, I would suggest you try out Coingrats free Discord server where we discuss the market and share interesting content. We have also have a free premium section where we share trading signals for Bybit. More info in our Discord server






