
This time we start with the monthly chart `because it is already November. The monthly close was just not high enough to become the highest monthly close ever, it was only $72. Nevertheless, it looks pretty bullish for the long term. The weekly resistance zone (blue) is broken and the candle is closed well above it, around the level of a previous monthly high ($13896).
The indicators we use to confirm, like the ema's, are still bullish and also the rsi is rising and is about to enter the bullish zone should it continue to rise. The LBR shows quite a bit of bullish momentum with perhaps a retracement to an earlier support level and then continue to pop.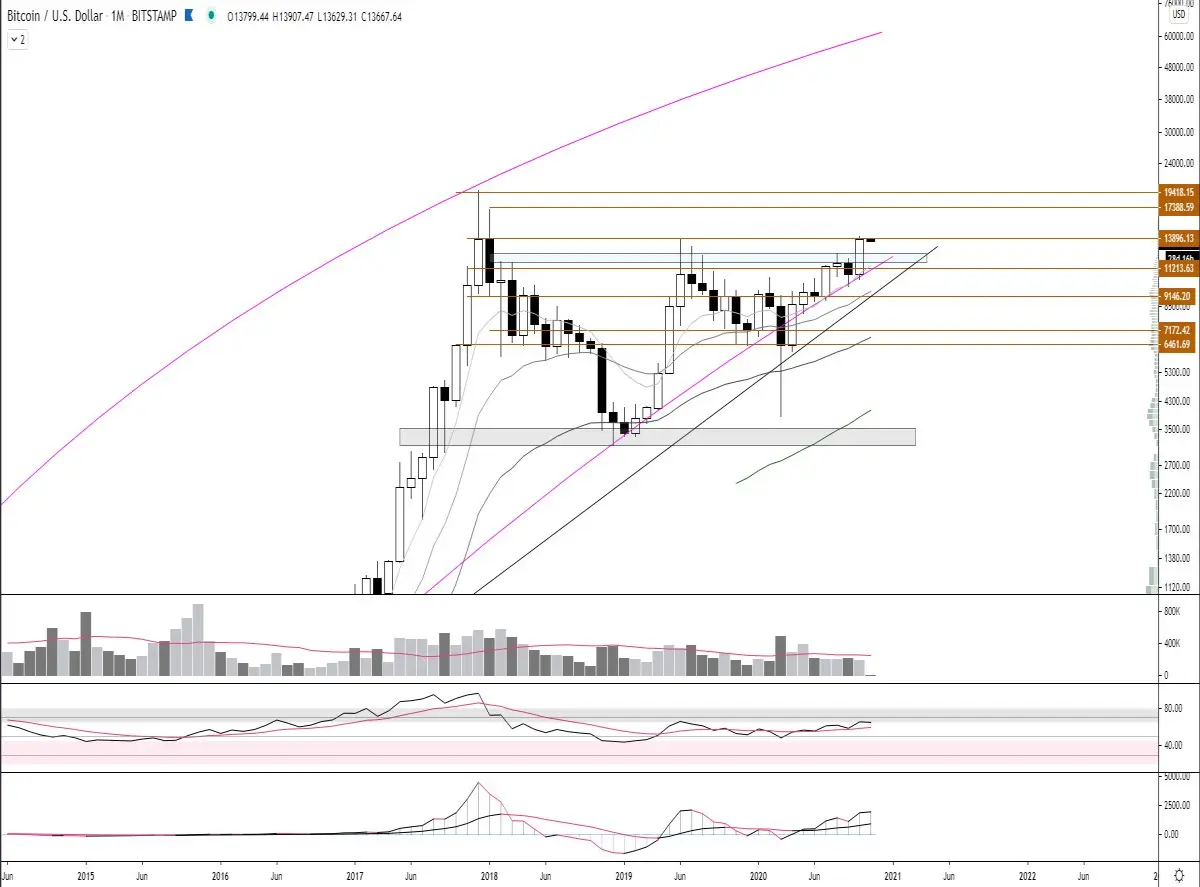
➡️ Join our free crypto Discord server and come talk about crypto charts
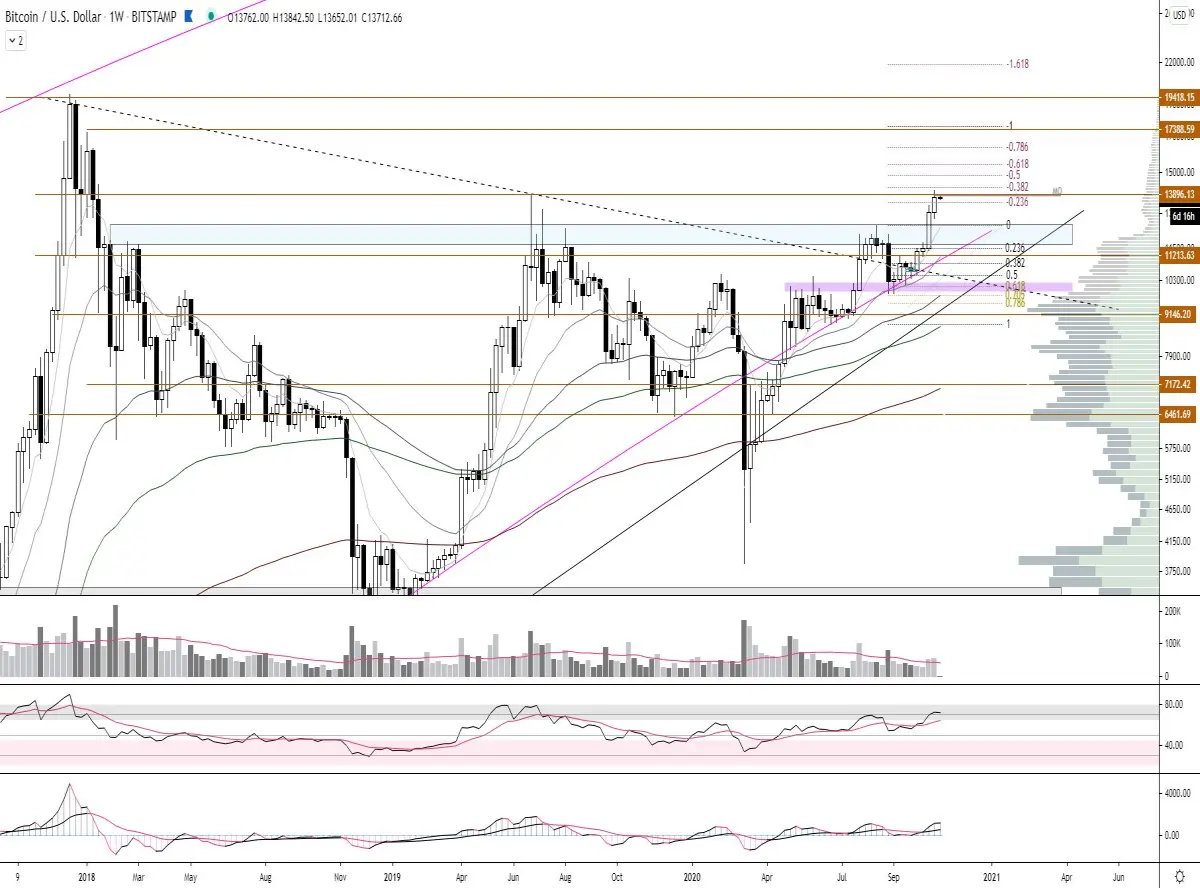
About the weekly chart we can be brief and powerful this time. We have put some beautiful bullish weekly candles on the chart. From the golden pocket retrace onwards BTC has risen by almost 40% and the next resistance we can see on the weekly chart is from 16.3 to 17.3K. As on the monthly chart, the ema's are also in favor of the bulls. The rsi is also in the bullish part but seems to be retesting the ema. Verdfer is not much to make out of this chart so we are going to zoom in to pick up the details.
On the 4 hour chart we still see higer lows being put on the chart for the time being but we also see that there is a bear div. How far will it drop or will BTC just ignore it? I myself think we need to go down first to catch our breath for a further rise. This is not the first bear div that has appeared on the 4h chart but already the 3rd in a row. Often this is an indication that it is a strong signal and that there is going to be a retracement on HTF.
The ema's still indicate bullish momentum although this is not very strong anymore. The volume is decreasing and also the rsi is decreasing and is not exceeding the ema. We see the divergences again on the LBR and it now also begins to show bearish momentum.
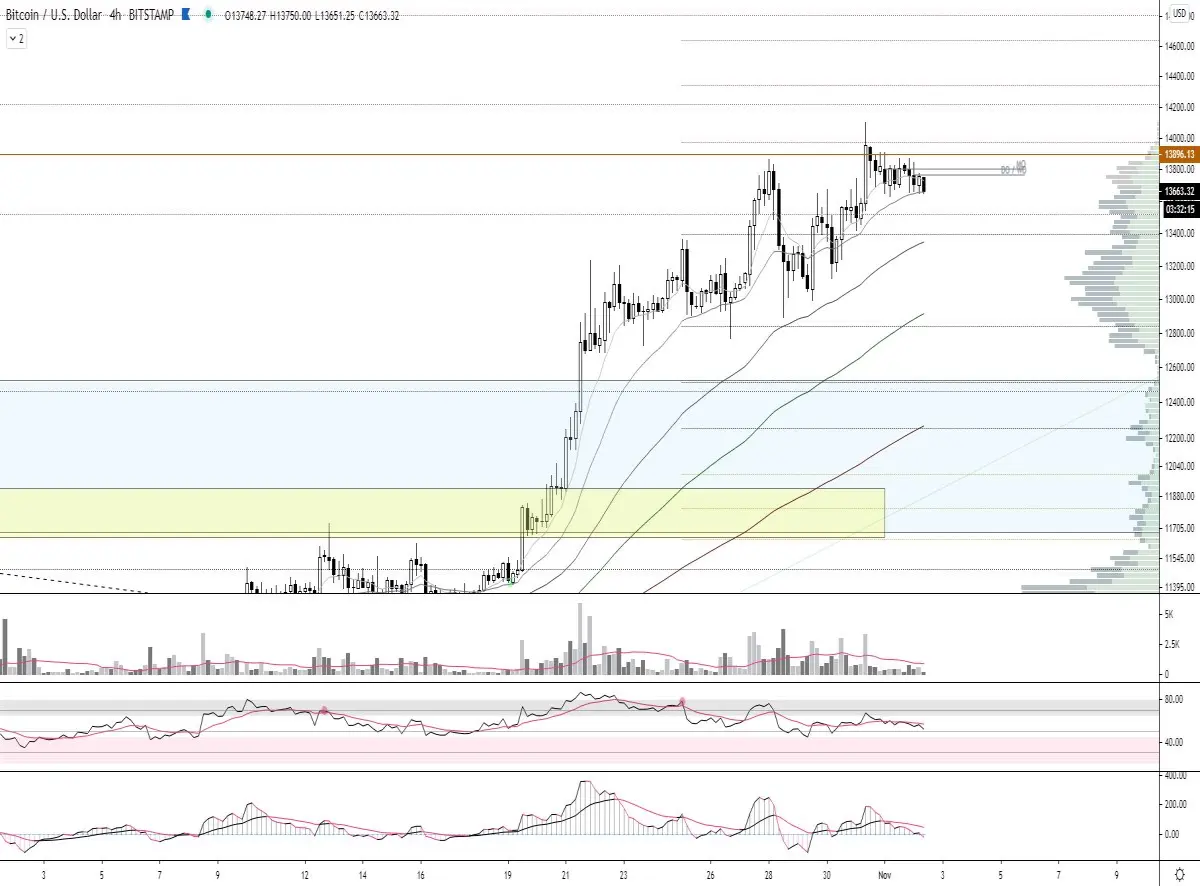
Conclusion: Longterm I am definitely bullish because on the HTF we have seen beautiful candle closes. However on the LTF I think the bulls have to catch their breath first. A healthy retrace towards the blue/yellow zone (11.8 - 12.4) on the 4h chart is not excluded. I even think it is desirable to go there ff 😉. This would correspond to a daily golden pocket retrace at the fibonacci level.
➡️ Join our free crypto Discord server and come talk about crypto charts
➡️ Get free lifetime access to our margin VIP room by making account on Bybit using this link and deposit 0.05BTC or more. Sent me your UID in our Discord channel or by a DM
➡️ Get $50 free when you ordered a crypto visa card from crypto.com using this link. (reff code: mk9r332rp2)






