
Disclaimer: This is not financial advice. Please do your own research or consult with a financial advisor before making any investment decisions.
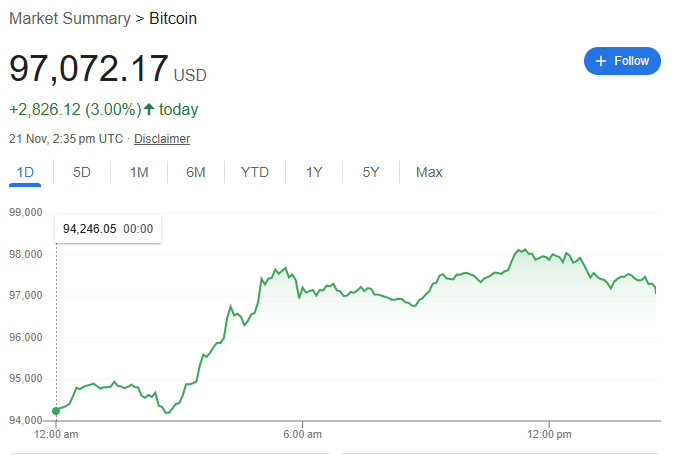
Bitcoin (BTC) has been riding a wave of bullish momentum, breaking through several critical resistance levels as of today, November 21, 2024. In this analysis, we’ll delve into the key technical indicators shaping its trajectory and explore potential scenarios for future price movements.
Key Technical Indicators
-
Moving Averages (MA):
- Both the 50-day and 200-day moving averages are trending upwards, a hallmark of a strong bullish trend.
- A golden cross—where the 50-day MA crosses above the 200-day MA—has recently occurred, solidifying the optimistic sentiment in the market.
-
Relative Strength Index (RSI):
- The RSI currently sits above 70, which signals overbought conditions.
- However, in a robust bull market, elevated RSI levels can persist for prolonged periods, showcasing strong buying interest.
-
Bollinger Bands:
- Bitcoin's price is trading above the upper Bollinger Band, indicating significant upward momentum.
- Historically, this could either suggest a continuation of the rally or foreshadow a short-term consolidation.
-
Moving Average Convergence Divergence (MACD):
- The MACD line is above the signal line, with both trending upwards, confirming a bullish sentiment in the market.
Potential Future Price Movement
The current technical analysis suggests that Bitcoin is firmly in an uptrend. However, given the inherent volatility of the cryptocurrency market, investors should remain cautious about potential sudden reversals.
Potential Scenarios
-
Bullish Scenario:
- If Bitcoin maintains its momentum, it could test and potentially break through key resistance levels at:
- $100,000
- $120,000
- $150,000
- A breakout above these levels could propel Bitcoin to new all-time highs, attracting more institutional and retail interest.
- If Bitcoin maintains its momentum, it could test and potentially break through key resistance levels at:
-
Bearish Scenario:
- Negative events, such as regulatory changes or macroeconomic instability, could trigger a reversal.
- A drop below the 200-day MA would be a significant bearish signal, potentially indicating a trend shift.
- Critical support levels to watch include:
- $80,000
- $70,000
- $60,000
Final Thoughts
Bitcoin’s bullish trend is unmistakable, supported by robust technical indicators. However, market participants should exercise caution and monitor key support and resistance levels closely. The cryptocurrency market is notorious for its volatility, and unexpected events can rapidly alter its trajectory.
Whether you're a seasoned trader or a curious onlooker, staying informed and approaching the market with a clear strategy is crucial.
Stay tuned to Tech Armors for more insights and updates on the world of cryptocurrency and blockchain technology.
Disclaimer: Cryptocurrency investments are inherently risky, and market dynamics can change rapidly. Always perform due diligence before making financial decisions.


