
Fibonacci retracement is a method of technical analysis for determining support and resistance. They are named after their use of Fibonacci sequences.
Fibonacci sequence
This is a series of numbers that is found by adding up two numbers before it. The sequence normally starts from zero. Here is the Fibonacci sequence;
0,1,1,2,3,5,8,13,21,34,55,89,144,233,377........ etc
-From the above Fibonacci sequence, we can notice that the 1 is found by adding two numbers before it which are (0+1)
-The 2 is found by adding two numbers before it which are (1+1)
-The 3 is found by adding two numbers before it which are (1+2) and so on.
From the Fibonacci sequence above, when you divide any two successive number, the second one divided by the first one, you will get what is close to the golden ratio which is approximate to 1.618034.you will notice that as the pair becomes bigger, the approximation becomes very closer. This is illustrated as below
A B B/A
2 3 1.5
3 5 1.6667
5 8 1.6
8 13 1.625
13 21 1.6154
21 34 1.61905
34 55 1.61765
55 89 1.61818
89 144 1.61798
144 233 1.61806
233 377 1.618026
The concept of Fibonacci retracement follows the golden ratio rule as seen above.
The Fibonacci retracement is expressed in percentages.The most commonly Fibonacci retracements are; 0%,23.6%,38.2%,50%,61.8% and 100%.These percentages are gotten by following the following steps;
61.8% golden ratio
61.8% which is considered as the key golden ration is gotten by dividing the first number by the next second number in the Fibonacci sequence i.e; 21/34 to get 0.6176 which is then multiplied by 100 to get 61.76%. If this is being rounded off, then it will give 61.8%
38.2 golden ratio
38.2% which is the second Fibonacci retracement is found by dividing the first number by the next third number in the Fibonacci sequence.i.e;21/55 to get 0.3818 which is then multiplied by 100 to get 38.18%. If this is being rounded off, it will give 38.2%.
23.6% golden ratio
23.6% which is the third Fibonacci retracement is found by dividing the first number by the next fourth number in the Fibonacci sequence.i.e;21/89 to get 0.23596 which is then multiplied by 100 to get 23.596%. If this is being rounded off, it will give 23.6%.
0%, 50% and 100% golden ratio
0%,50%, and 100% are not considered as Fibonacci retracements.50% is used because it is based on dow theory which states that a trend movement will continue to move as long as there is a 50% retracement either downwards or upwards while 0% and 100% represent the low and the high price that is used to draw the Fibonacci retracement using the Fibonacci tool.
conclusion on golden ratios
Therefore we can conclude that the Fibonacci retracement is gotten by diving the first number by the second number, dividing the first number by the third number and dividing the first number by the fourth number in the Fibonacci sequence respectively. This is how a Fibonacci retracement looks like;
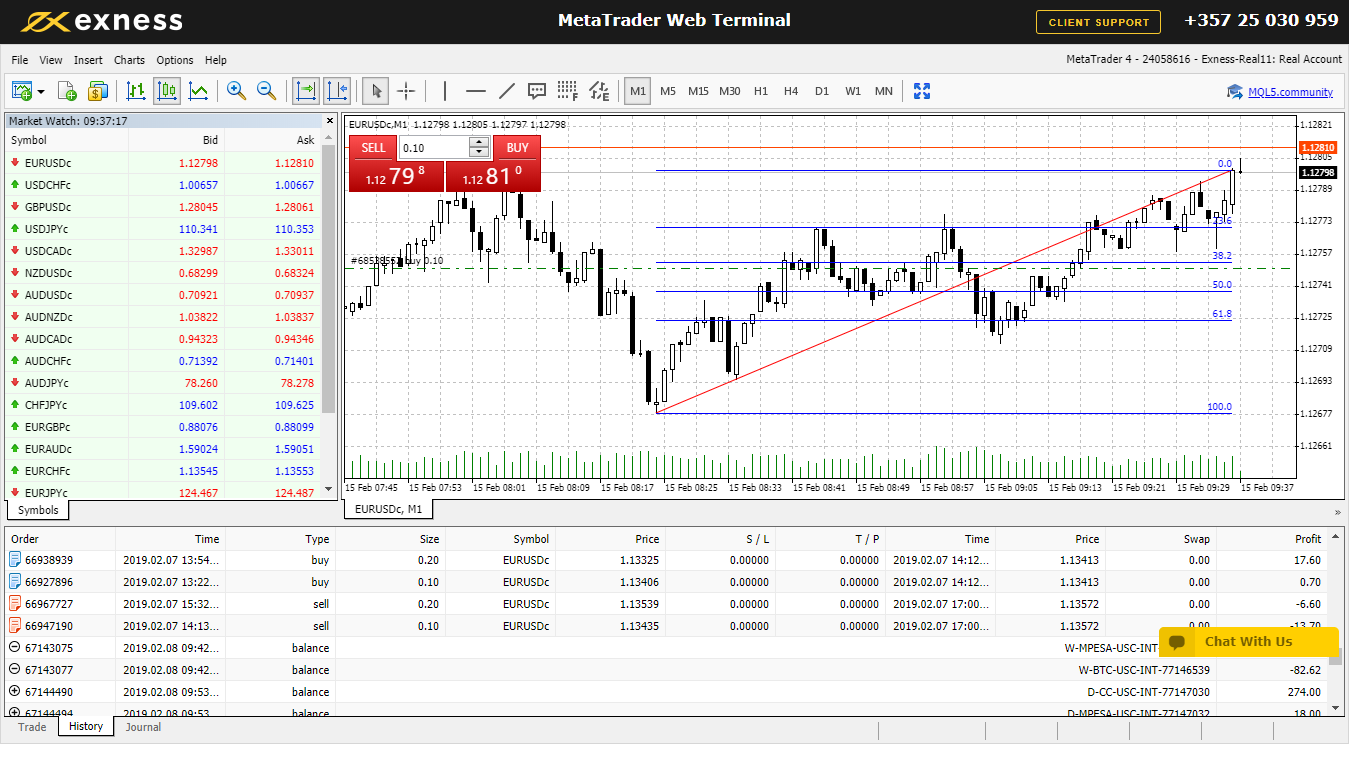
In the figure above,there are 6 fibonacci retracement,that is 100%,61.8%,50.0%,38.2%,23.6% and 0.0%.
100% represents the lowest fibonacci retracement while 0.0% represents the highest fibonacci retacement.While tracing the fibonacci retracement using the fibonacci tool,one should expand the tool from the lowest point to the highest point .This will result to all the retracements appearing,that is 61.8%,50.0%,38.2% and 23.6% as shown above.
The retracement above is an upward trend. For an upward trend, it shows the retracements point in which one should enter a buy position because the market will be moving up. Since it is an upward trend, the best entry points for a buy position will be 61.8%,50.0%,38.2%, and 23.6% respectively upwards. The lowest point is 100% which starts from down while the highest point is 0.0% which ends from up as shown above. The same will apply for a downward trend. In a downward trend, the retracement will enable one to enter a sell position because the market will be moving downwards. Since it is a downward trend, the best entry points for a sell position will be 61.8%,50.0%,38.2%, and 23.6% respectively downwards. The lowest point is 100% which starts from up while the highest point is 0.0% which ends down. This is shown as from the diagram below

recommendation:From the two Fibonacci retracement graphs above,if you are a day trader,you can either choose to use the tool on a 1minute time frame,5minute time frame,15minute time frame and 30 minute time frame while if you are a swing trader you can choose to use the Fibonacci tool using the 1hour time frame going forward.
Recommendation 2: Use common sense while trading with the fibonacci retracement tool
skrill donation: [email protected]
neteller donation: [email protected]
Bitcoin :1Fp5aLgRB6WJnC7nxGw57M3JbbexaAWHG2
Ethereum; 0x346570c491b76c7cd51699bdd272762111b743a9
Litecoin: LeEH7B82ccXJ6QoibCryGJNpDGNx2x77fL
Dogecoin: DLShs2vqhMc1ggqo8MPPMBTcPAZdqCZoWd


