![XRP / BTC technical analysis [BINANCE]](https://www.publish0x.com/img/19553.png?action=resize&ar=1&inv=0&ori=1&st=1&up=1&w=1140&signature=82e43f48df5625a6695e0fb9948d7b8b9a22ee24c38124b819c0597a9c3340a9)
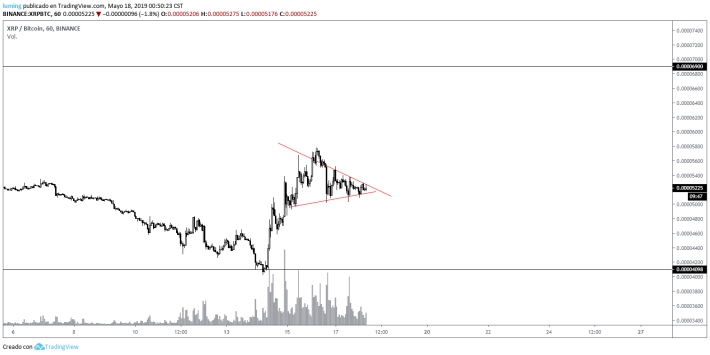
XRP seen from the temporality of 1H we can see how the structure of the candles have formed a symmetrical triangle, the highs are lower and lower while the lows are higher and higher, we can also see how there is a correct accompaniment of volume, this has been falling as the candles have been contracting inside the figure.
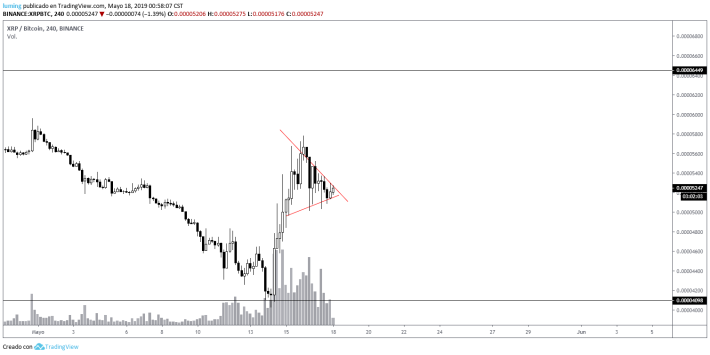
XRP seen from the temporality of 4H we can see how the last two candles have been bullish, the latter is still in development and we see testing the resistance of the figure, seems to show enough momentum, to break the resistance we will see a strong bullish movement that should reach without problems to the resistance of the EQ point of the range located at 6449.
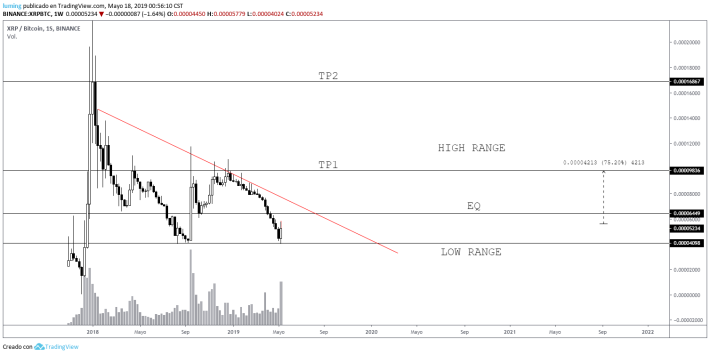
XRP seen from the temporality of 1W we can see how the current candle after having found support in the 4097 has formed a double floor that comes to be a great signal for the bulls, in the image above I have placed the take profits to reach if there is a strong movement to the rise to break the point EQ located at 6449, it is important that the candles manage to close above that point to then have a test of the high range. The first take profit is at 9836, while the second take profit is at 16867.
In conclusion, if the candles in 1H manage to close above the figure we are going to have a strong bullish movement that should reach the EQ point without problems, there we should see how the price reacts to this resistance, from my point of view should not have problems breaking it, however, always be aware of the movement.
As I always say, you have to be aware of the movement, invalidations can occur, there is no 100% reliable analysis, take your own precautions when trading.


