![XMR / BTC technical analysis [BINANCE]](https://www.publish0x.com/img/15495.png?action=resize&ar=1&inv=0&ori=1&st=1&up=1&w=1140&signature=38b7466b50881174d0253eed3972c3076931107db9095fbe9677d99931b3d4dc)
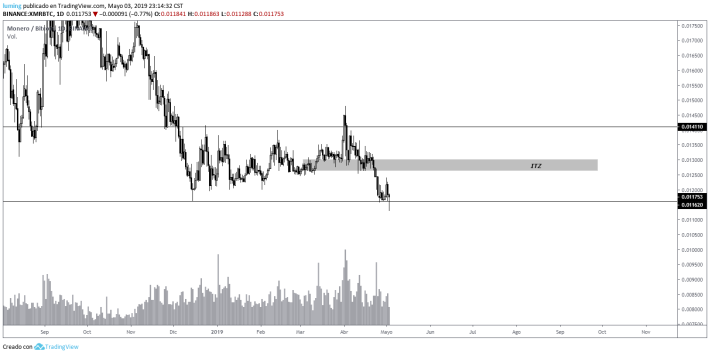
XMR seen from the temporality of 1D, we can see how it is finding strong demand in the support of the low range located at 11620, forming a hammer candle, which is a good signal to buy, from here XMR could gain momentum towards the ITZ point indicated on the chart, this area would be our first take profit, the price could continue to rise more, but for this we need to close tightly above the ITZ point and do a throwback within that level.
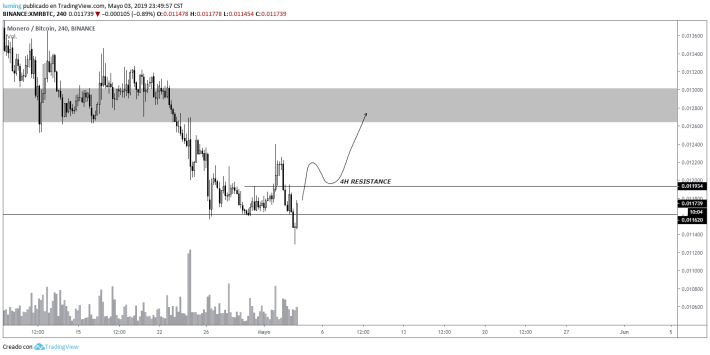
Seen from the 4H temporary we can see how the current candle is closing above the support, making a recovery that could support the possible bullish movement, in the chart above I have indicated the nearest resistance of 4H located at 11934, it will be important to see how the price reacts when reaching that level, if it manages to mark a wick above the resistance, We should not have problems to reach the ITZ point in the short term, however, we always have to wait for the confirmation of the following candles, sometimes we have these types of recovery and the next candle loses the level precipitating the fall, so I recommend not to make rash operations in the market, we must wait for confirmation plus a correct testing of the level.
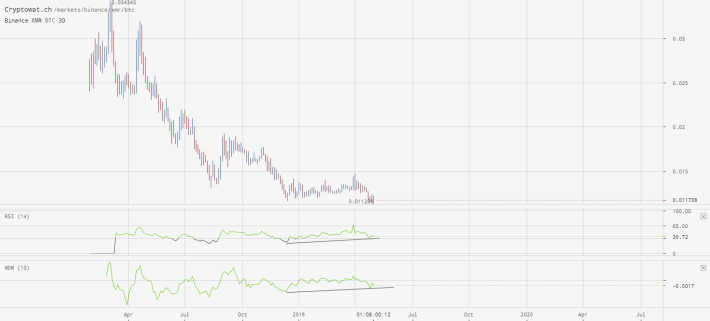
Seen from the 3D temporary we can see bullish divergence in the RSI (Relative Strength Index) and momentum indicator, both indicators support a possible upward movement of part of XMR.
Currently the altcoins market is in red numbers due to the increased dominance of the BTC, currently the chart maintains an upward setup that can result in an increase in its dominance causing a greater fall in the price of the markets, this happens because most traders sell their positions to enter the BTC directly, therefore, the best thing at this time is to avoid trading in the altcoins and if they do, you must have well configured stop-loss to avoid losses.
As I always say, you have to be aware of the movement, invalidations can occur, there is no 100% reliable analysis, take your own precautions when trading.


