![SYS / BTC technical analysis [BINANCE]](https://www.publish0x.com/img/15736.png?action=resize&ar=1&inv=0&ori=1&st=1&up=1&w=1140&signature=b7d0625e3e3547cbd3a39711add7729cfde24804c65a809fc0395613d7480dc9)
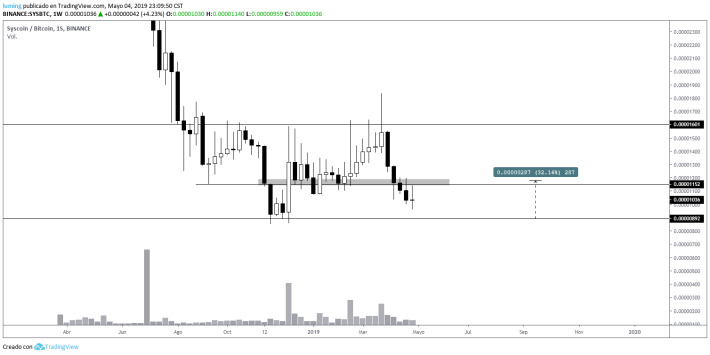
SYS seen from the temporality of 1W we can observe volume entry, the current candle at the time I am performing this analysis is performing a doji, this type of candle after a bearish cycle can represent the end of the trend and the beginning of a bullish trend, for it is advisable to wait for the confirmation of the next candle, which should be May to that of the doji.
The support is located in the 892, therefore, we could be in front of a trap for bulls, it is difficult to know, but we will analyze it below in other temporalities, meanwhile, in 1W I have indicated as target zone of take profit the area indicated inside the gray rectangle located inside the range of 1145 - 1187, in case of a change of strong tendency, it is very possible, even, that we reach the next take profit indicated in the graph with the resistance located in the 1601.
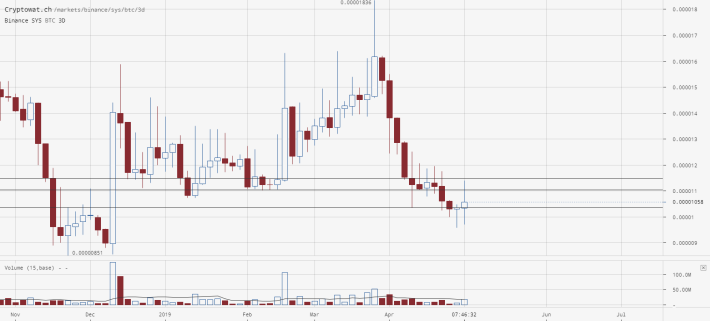
SYS seen from the 3D temporality we can observe how the current candle is surpassing the previous one in volume placed above the support, this is a good signal for the bulls, however, as long as it does not exceed the area delimited with 2 lines above (indicated in the graph) there is the possibility of continuing to lower.
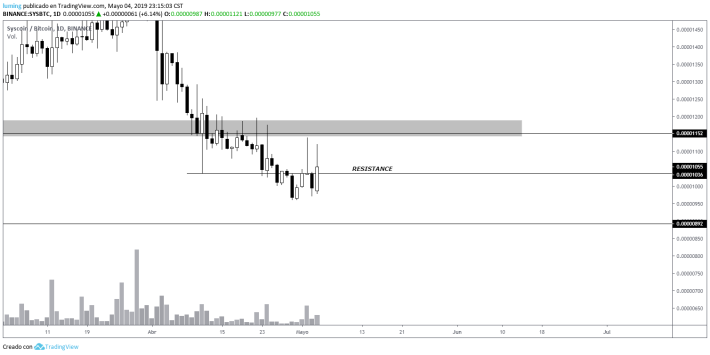
SYS seen from the temporality of 1D we can observe until the moment as the daily candle is above the resistance of 1D, to close above and get confirmation with the next candle, we could see an important bullish movement, for the moment we are getting good information.
Another important fact that we can observe in monitoring the price in this temporality is how the lows are getting higher and higher while the highs are getting lower and lower.
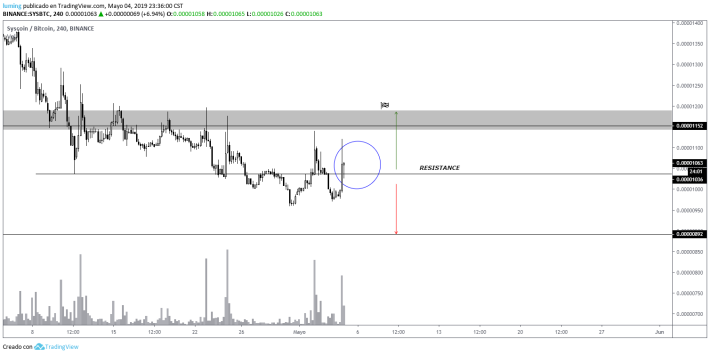
With the temporality of 4H we have a closer view of what is happening with the price, I have drawn a blue circle on the chart because the development of the next candles within that range will be very important for the trajectory that will follow the price, so far we have support recovery and correct testing in the current candle, we can see how the lower wick is long, which indicates a greater interest on the part of the buyers, although this by rule should be so, we should not be confident, we could have a throwback that breaks the support and ends up not recovering it, if this happens we would be facing a bearish scenario, therefore, I have indicated in the chart two arrows indicating the future movement of the price according to the scenario that we present in the next few hours.
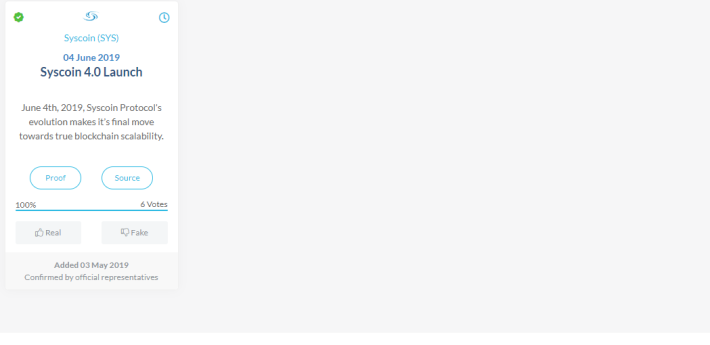
In its fundamentals we have an important event, the launch of syscoin 4.0, an evolution in the currency that will bring greater scalability within its blockchain, the fundamental has been confirmed by official representatives.
In conclusion, if we stay above the 1036 support and see an upward movement above the consolidation, we can go into long, otherwise, it would be better to wait for the 892 support.
As I always say, you have to be aware of the movement, invalidations can occur, there is no 100% reliable analysis, take your own precautions when trading.


