![BCPT / BTC technical analysis [BINANCE]](https://www.publish0x.com/img/19294.png?action=resize&ar=1&inv=0&ori=1&st=1&up=1&w=1140&signature=d2cb18a01fcdb216bde511a7025a50eaf3aec28647b8b62d7e9425ddc2760acc)
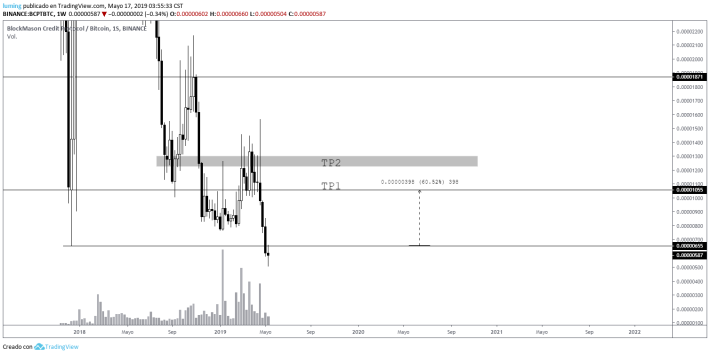
BCPT seen from the 1W temporary we can see as the current candle begins to show momentum change on the chart, this type of candle at the end of a bearish trend indicates a possible change of trend, if there is a strong entry of volume we should see an upward movement very soon.
The first take profit is located at 1055 and the second take profit is located within the price range of 1225 - 1300.
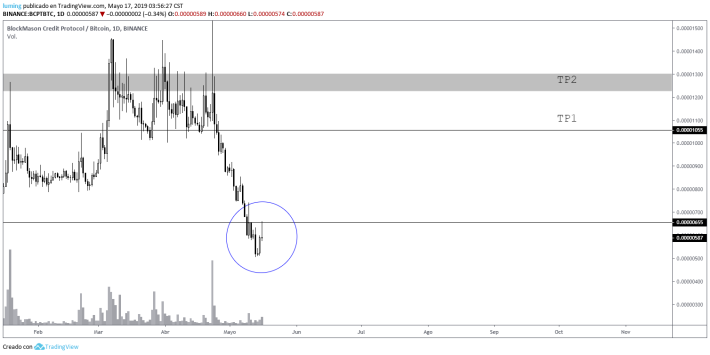
BCPT seen from the temporality of 1D we can see how the previous candle has surpassed the consolidation range surpassing its predecessor, this is a good buy signal, the current candle is testing the resistance of the 655, from my point of view I do not think I have major problems to break that point.
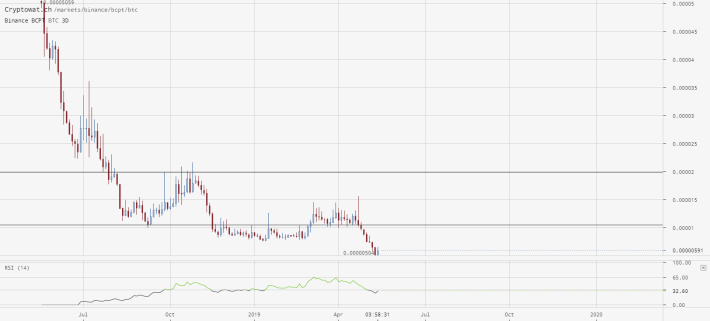
BCPT seen from the 3D temporality we can see how the first bullish candle is being produced after eight bearish candles, this would come to confirm the above mentioned from other temporalities, the RSI indicator is at oversold levels showing bullish divergence.
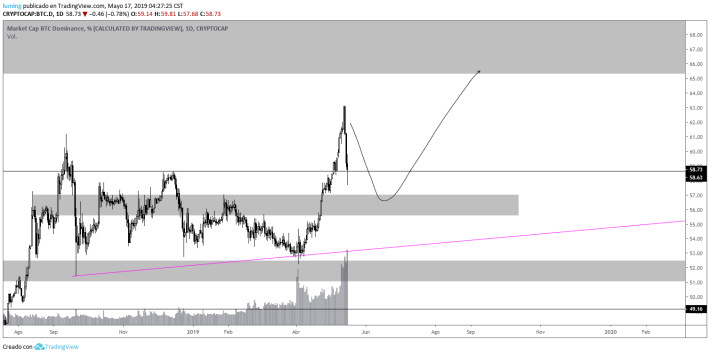
The dominance of the BTC is testing the support of 58.73, this being the resistance of the figure, we could see a couple of days of consolidation at this point, even a move lower as shown by the trajectory plotted within the chart.
In conclusion, BCPT could have a strong bullish movement very soon, it is in good time to buy, to this we add the excellent action of the price in the candles as indicators of change of trend, being the dominance of BTC lowering the market of the alts receive enough demand which causes the price to rise drastically.
As I always say, you have to be aware of the movement, invalidations can occur, there is no 100% reliable analysis, take your own precautions when trading.


