
Swissborg makes a tremendous progress since its roll out. Giving investors the ability to use technical ressources to predict the price of an asset.
With the SwissBorg´s Wealth App in Hand, user can predict hourly the price of the following assets (BTC, ETH, CHSB, USDC, PAXG (coming this month). This Article shows you how the AI machine learning CyBorg Predictor is working. To check the analysis you can see the updated analysis of your favourite crypto in the Learn tab of the Market section which we will continuously optimise and be udpdated.
The current analysis is based on the price in USD and is composed of the following information:
FEATURES
A. The Cyborg Predictor (prediction for the next 24 hours)
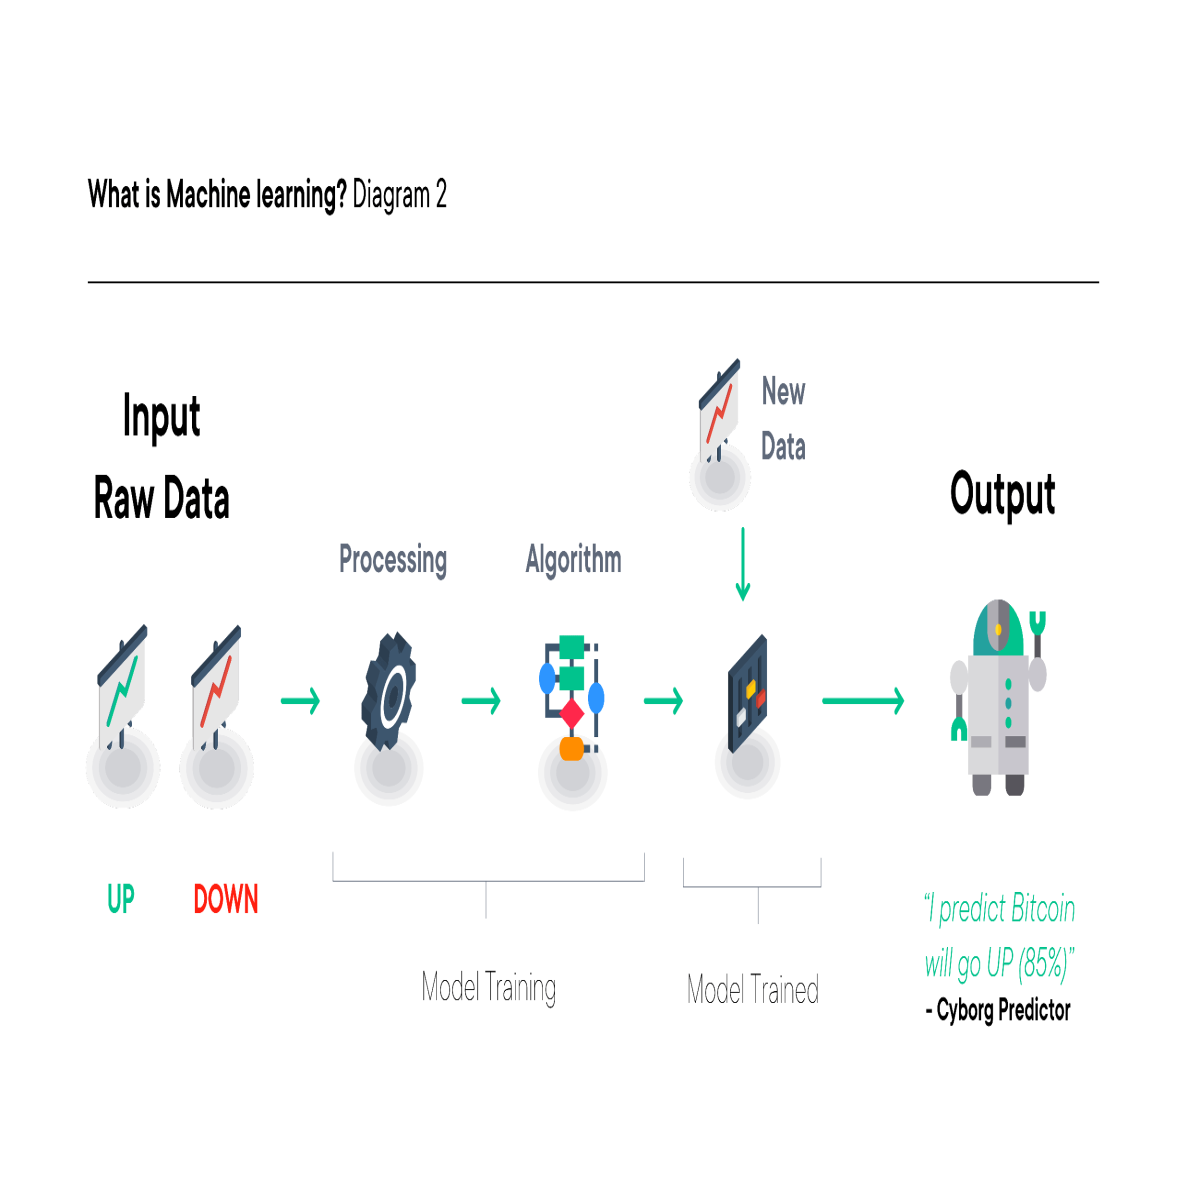
The Cyborg Predictor has beaten over 95% of players on the Community app in predicting the price of Bitcoin, is now updated hourly and deployed across all Wealth app products. It predicts the market movement for the next 24 hours: Bullish (Up) or Bearish (Down).
This Machine Learning algorithm interprets historical market data and combines technical indicators for you in a systematic way. In other words, it combines an amount of information that is impossible for a human to take into account to give you a short-term prediction. As an extra, you will discover the Cyborg Predictor's strength. The greater strength, the more confident the Cyborg Predictor is for the next 24 hours.
Once we have this model that has learned, it is possible to give it a new data point. The model will use the found parameters to give the expected solution.
Similarly to Swissborg, the model performs better the more it sees data and the closer it gets to the new ones to predict.
B. The SwissBorg Indicator (Current Trend)
The SwissBorg Indicator gives you the current state of the market trend in one single indicator! Indeed, there are several types of indicators that allow you to have different views of the market. For example, you can find oscillators, momentary indicators, trends and others.
It is difficult to form an opinion from all the information available. To be able to do this, we have combined, in a weighted way, the most relevant technical indicators to create a single indicator that gives you direct information on the state of the market.
This single indicator consists of the following indicators (see glossary below):
a. The RSI (14)
b. MACD lines
c. The Bollinger Bands
d. The trend over the last 10 days
As for the CyBorg Predictor, this one single indicator features different levels of strength. In other words, it indicates how bullish or bearish the market is at the moment: the more strength the Cyborg Predictor has, the more bullish the market.
C. The Community Sentiment (in the Last 24 hours)In addition to a prediction for the next 24 hours and the current market trend, you will find the sentiment of the community in this analysis. This indicator is based on the volume of transactions on the Wealth App over the last 24 hours that reveals the balance between the buying and selling pressure. An indicator close to 0% points to a bearish sentiment, an indicator close to 100% signals a massive buy, while 50% indicates a neutral sentiment.
D. A live chart with technical indicatorsOn this chart, you will find the daily candle of the live USD price. There are additional indicators if you need more information for your decision making: the price dispersion (Bollinger Band), the 20-day moving average and the MACD lines that give you a reading of the current market momentum.
E. Automatic Calculation of Support and ResistancesLevels of support and resistance are critical levels to monitor and are not always obvious to identify. That is why we wanted to provide this information automatically for our community members! To save you time, we analyze volume profiles over the last few months to identify the first levels of support and resistance for free.
F. Automatically generated Technical Analysis
Based on all the market information available to us, we generate a technical analysis that is updated hourly. It takes into account information from the Cyborg Predictor, all the technical indicators that we consider, as well as price and volume variations.
In a few words, you will find a summary of the market situation. G. Market Stats
In this section, you will find additional statistics for each token listed on the Wealth App such as:
- The Rank calculated by CoinMarketCap based on the market capitalization of the token or coin
- The Dominance or, in other words, the importance of the market capitalization of the project in relation to the market as a whole
- The Market Capitalization which is defined as the price times the number of tokens in circulation
- The circulating supply which is simply the number of tokens or coins that are publicly available and circulating in the market
And much more...
The Hourly Asset Analysis is continually optimized. Algorithms are reviewed frequently to optimize their use and new information will be added to satisfy the needs of our Community.
I tested the scheme about 10 times within this range the cyborg predictor was 7 times right.
START LEARN AND EARN! WIN UP TO 1 BTC in The SwissBorg forcast game. USE OA62FUI in the wealth app and get 3,000 points right in your bag. Earn up to 1,750 CHSB Tokens.


