
Nvidia is making huge waves in the global market by sharing their latest solid financial report. For readers and market observers who follow this tech giant, this quarter proves that the demand for artificial intelligence and the Blackwell architecture continues to show remarkable adoption on the ground.
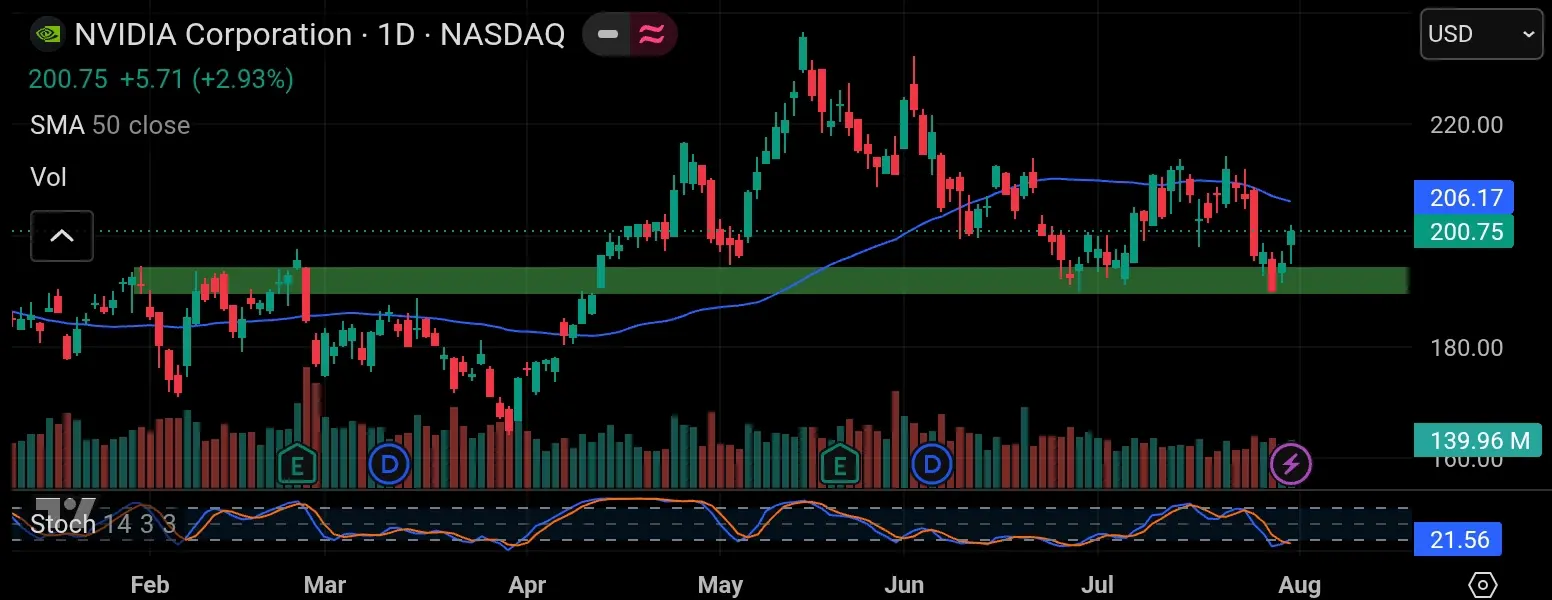
If we review Nvidia's daily chart above, the asset price went through an extended consolidation phase before attempting a pullback above the green demand zone area. The stochastic indicator is also starting to slope downward near the lower boundary, indicating that selling pressure is easing and creating potential for the price to test its nearest support area before the next phase.
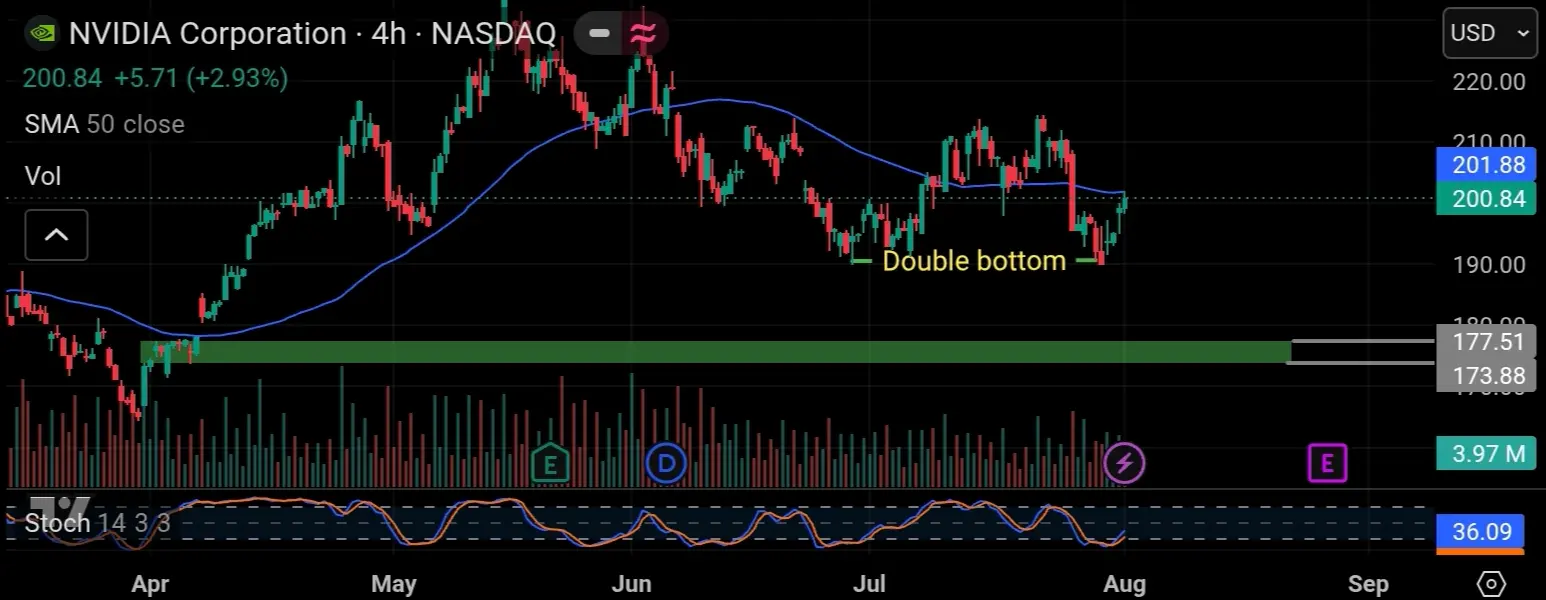
Examining the fourhour timeframe more closely, the market structure formed a minor double bottom pattern around the established support area. That green zone at the bottom serves as an area of interest for participants observing structural price action and risk parameters.
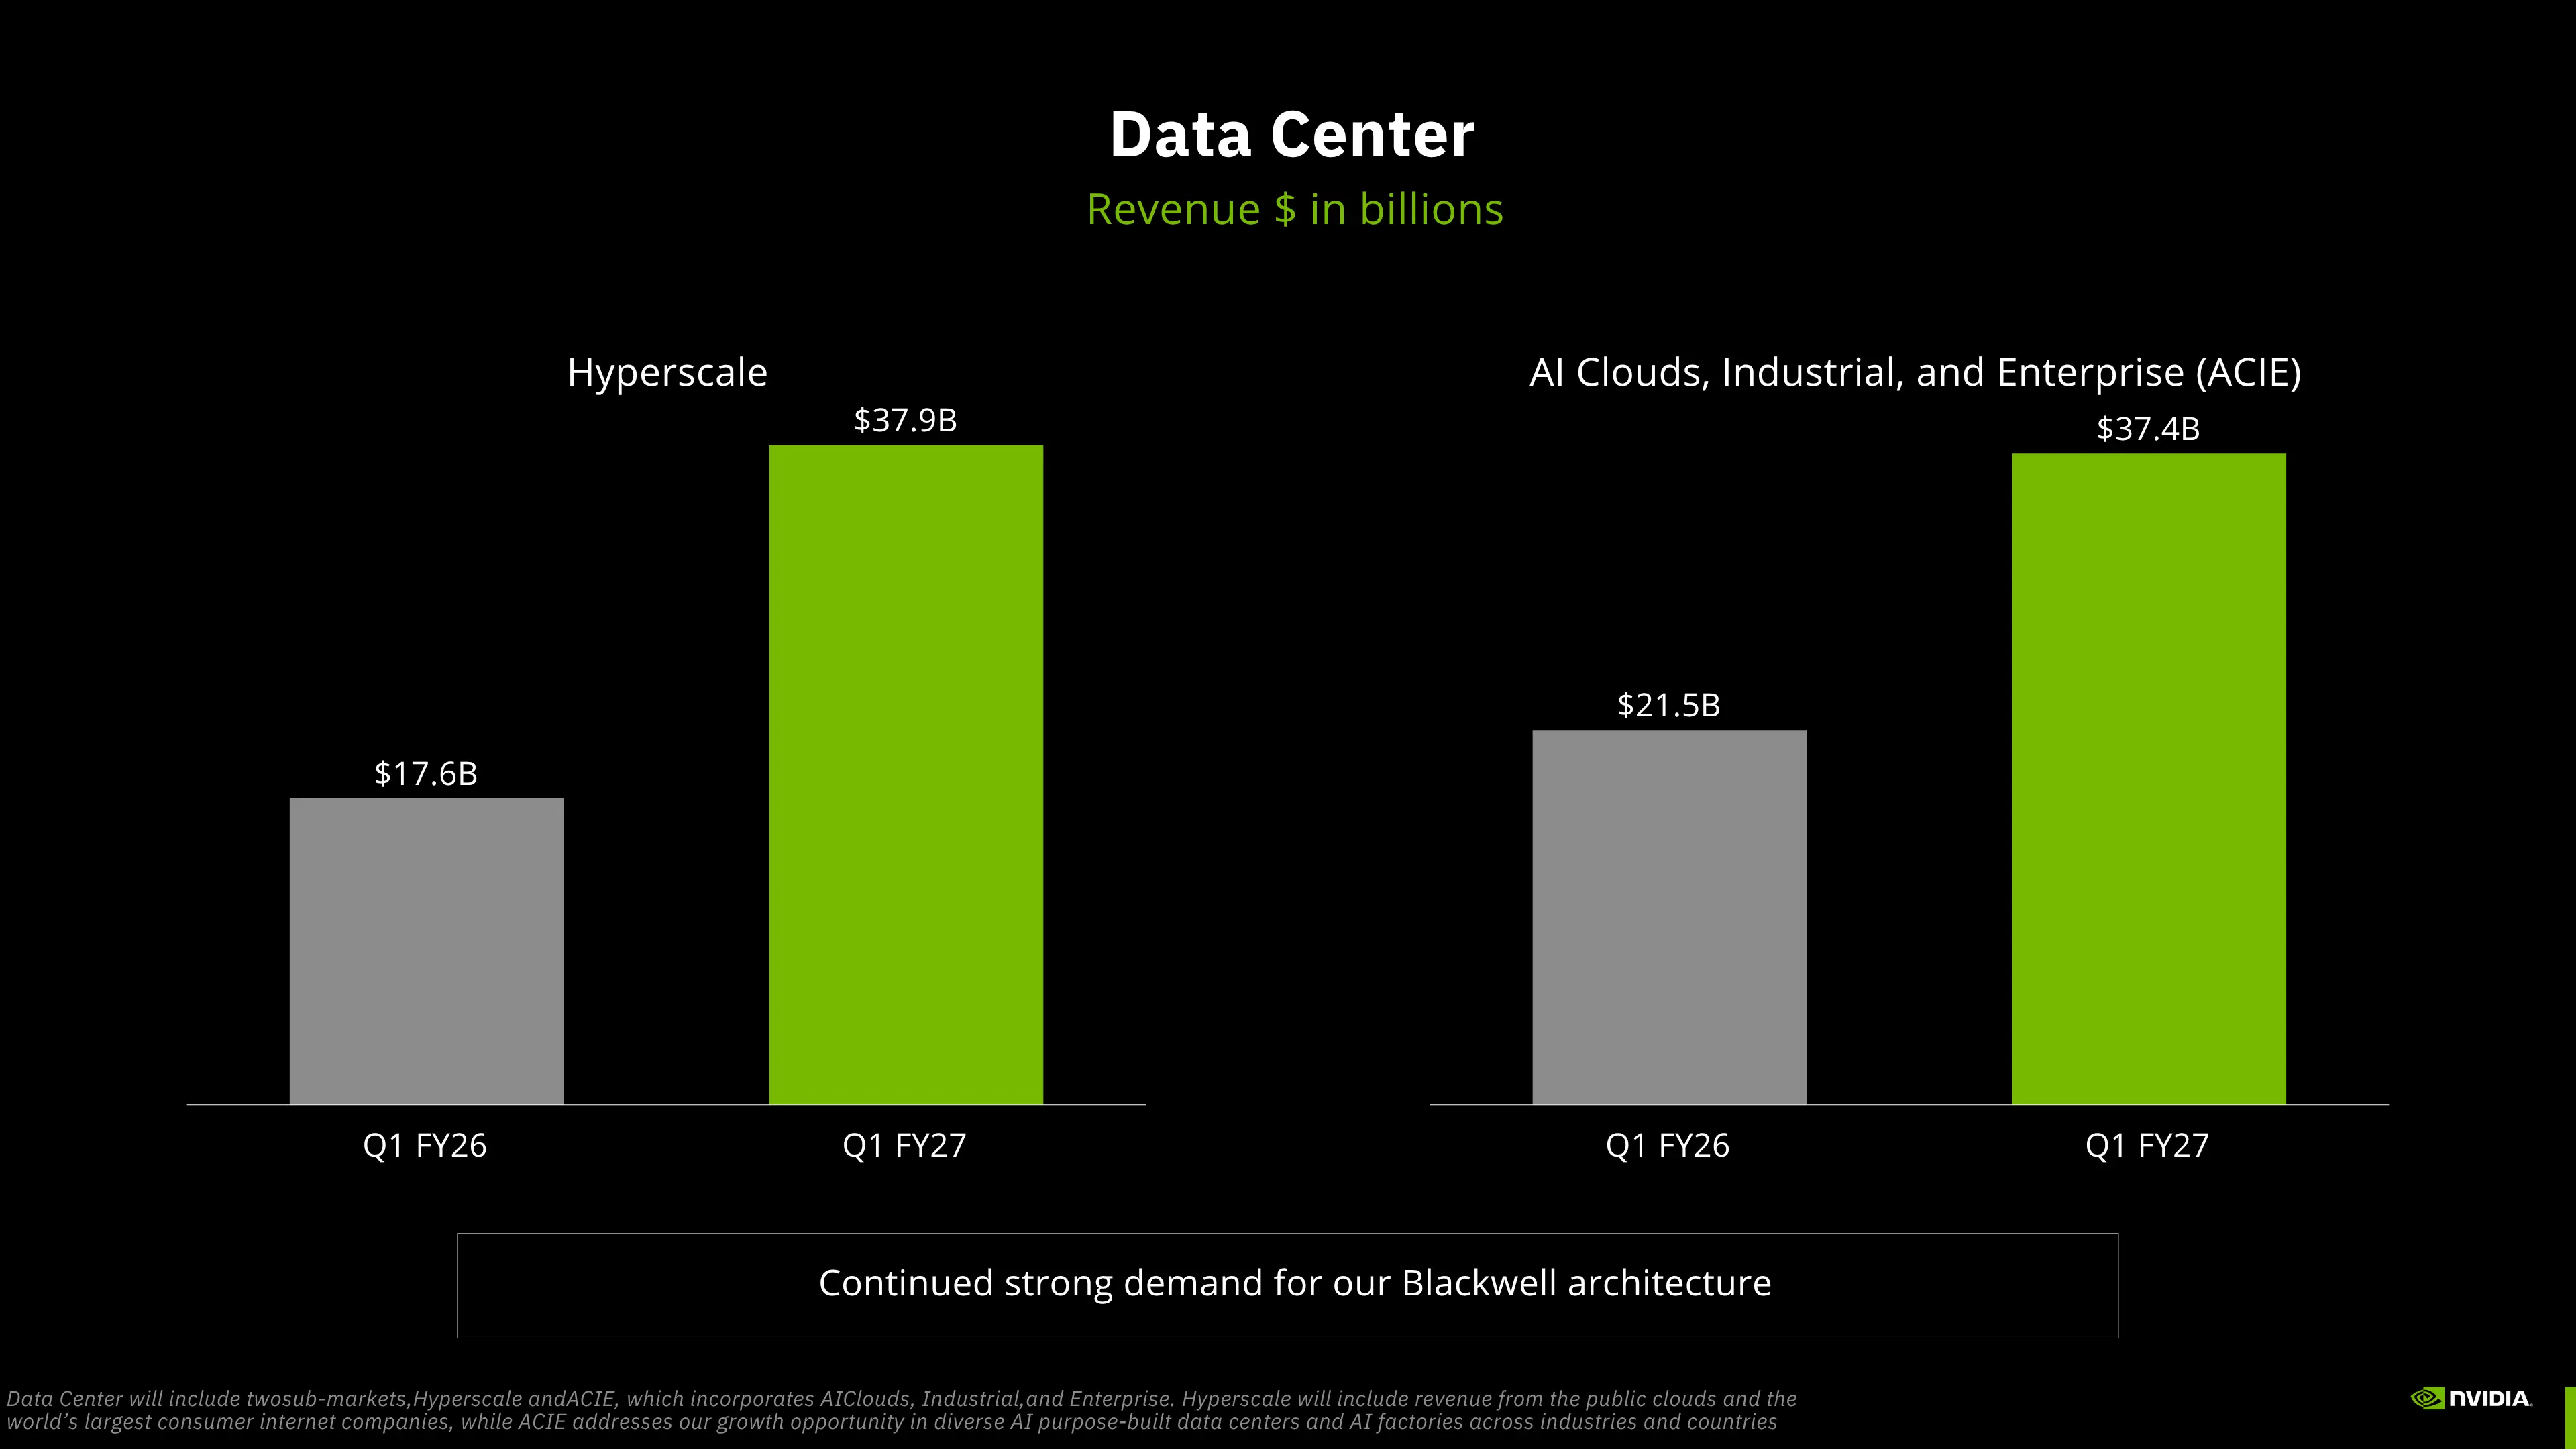
This performance milestone is driven by the massive contribution of the Data Center division, which demonstrated significant scaling. From the Hyperscale segment alone, revenue reached $37,9B, while the AI Clouds Industrial and Enterprise segment contributed $37,4B. The aggregate figures from this division highlight the extensive expansion of enterprise AI infrastructure.
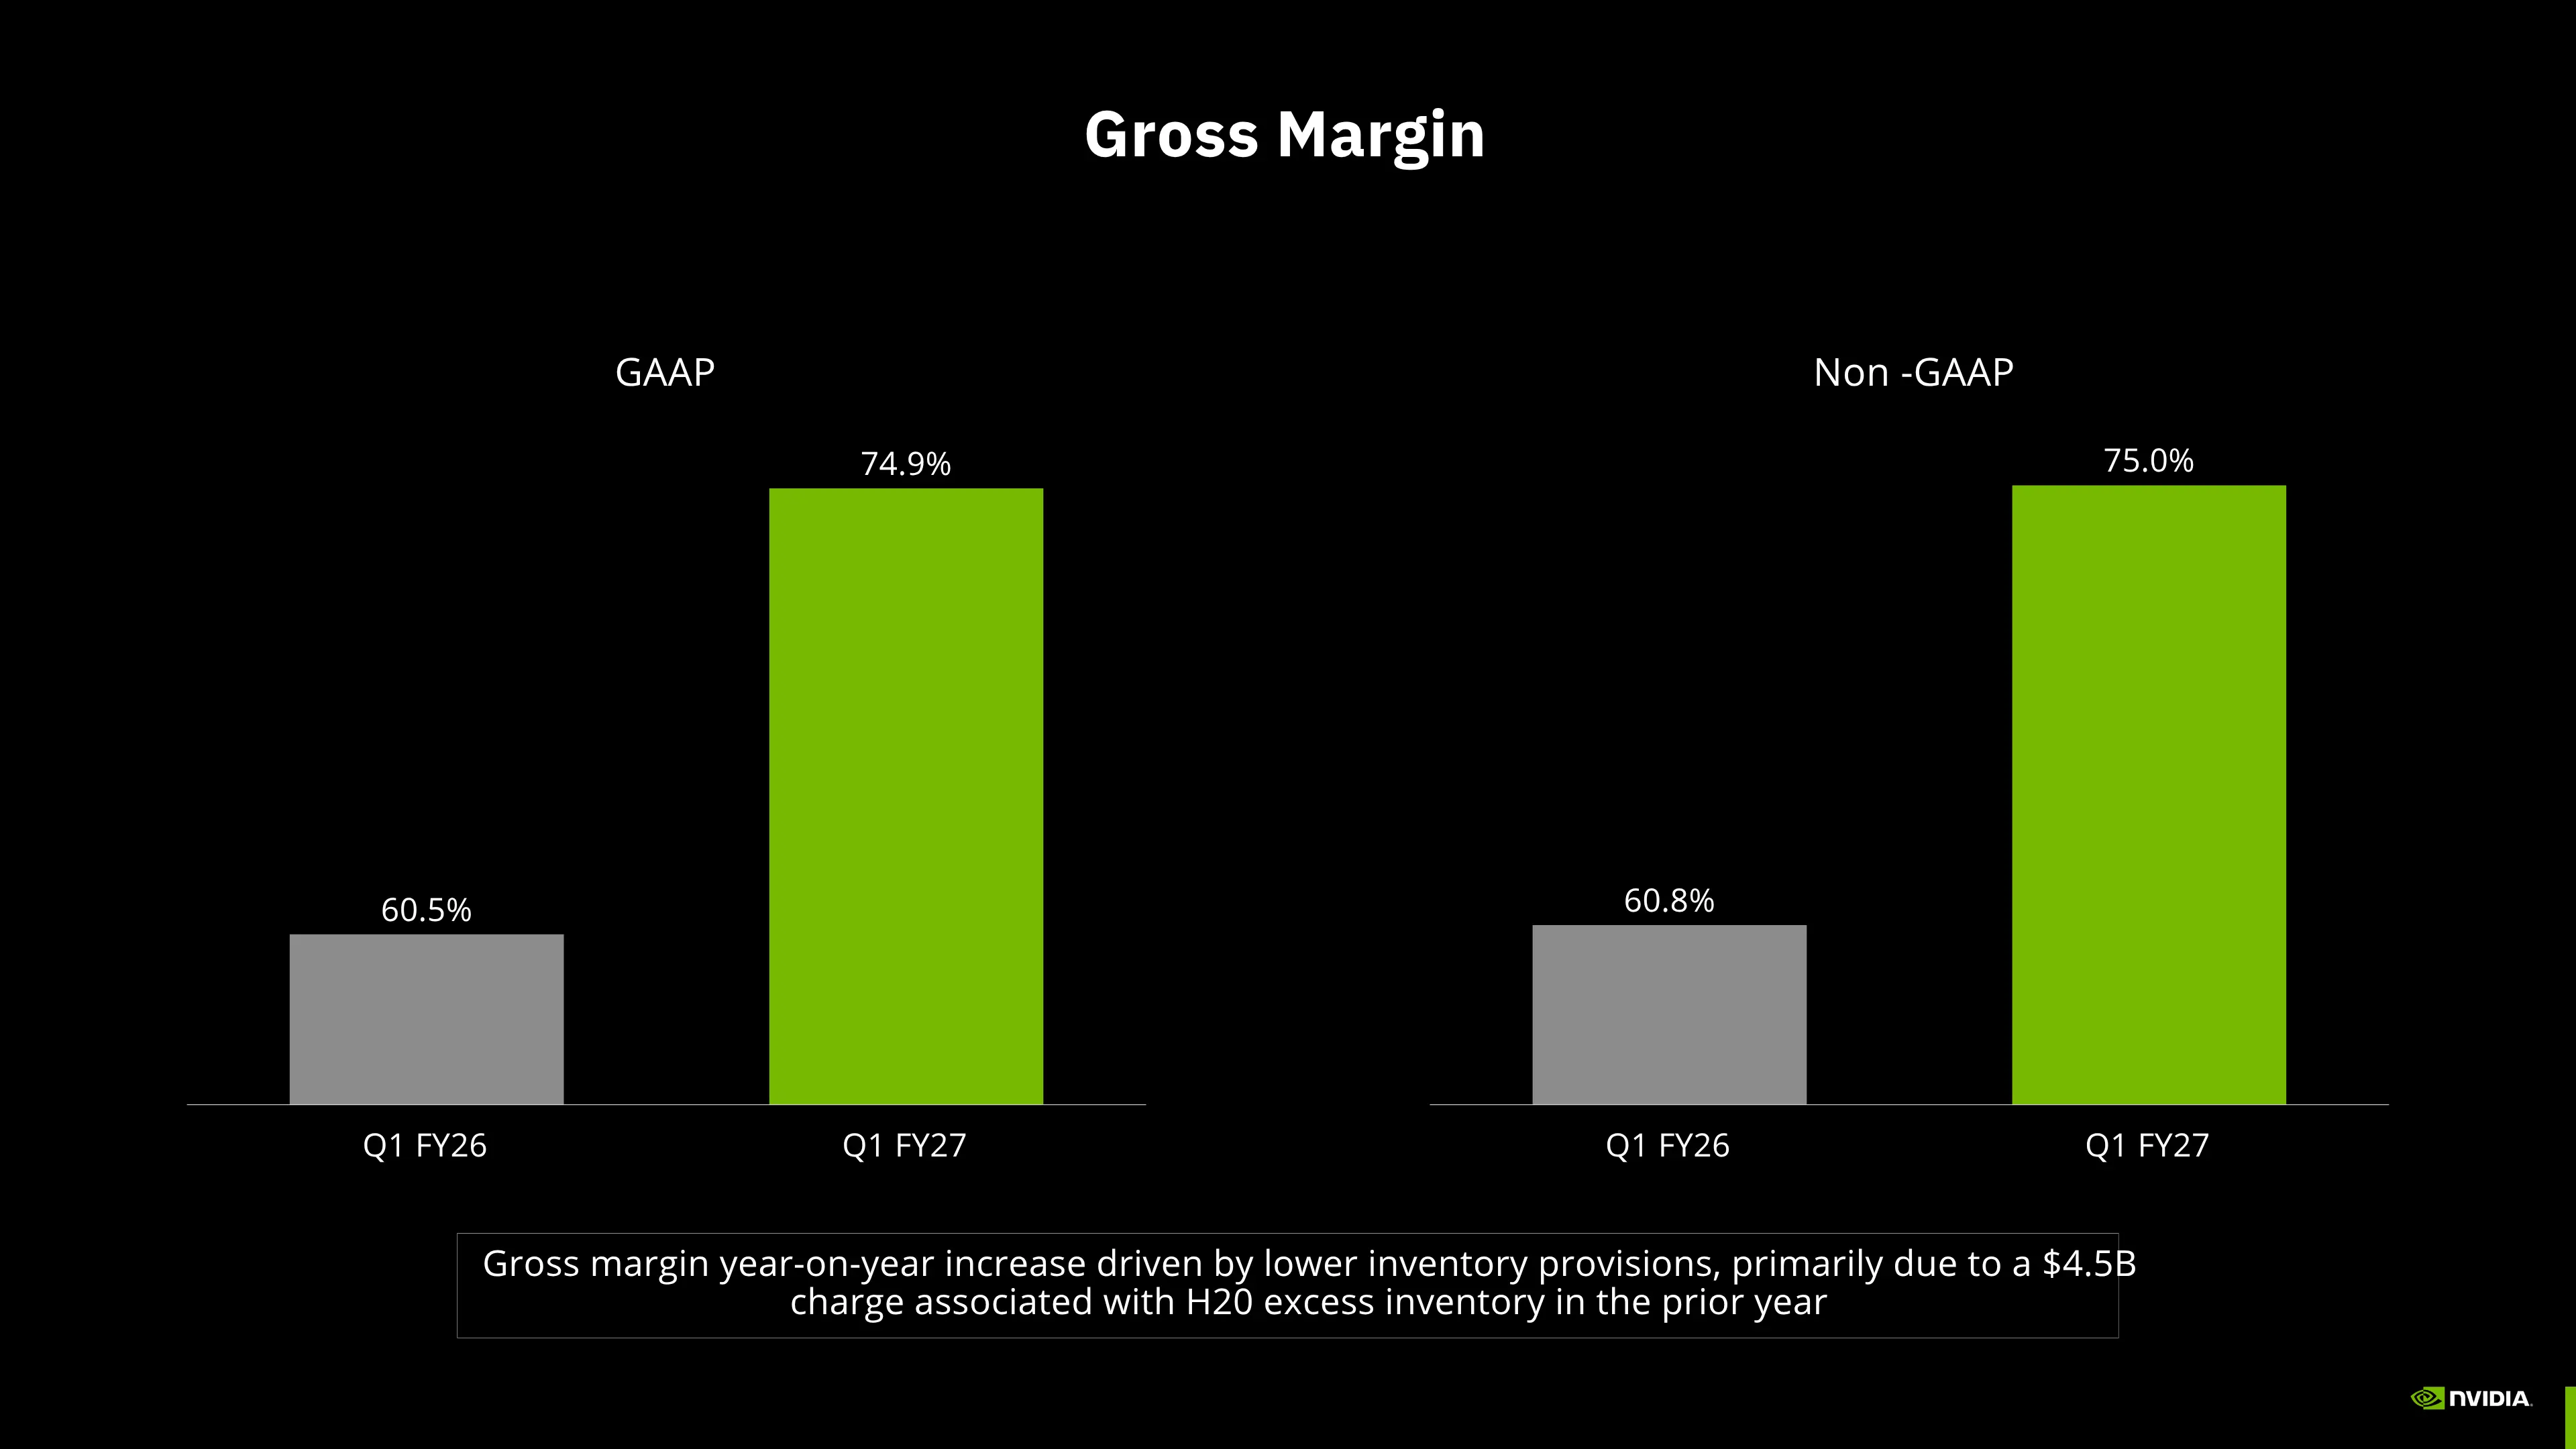
Regarding profitability, the company's Gross margin reflects strong operational efficiency at 74,9% for GAAP and 75,0% for Non.GAAP. This margin optimization was supported by lower inventory provisions compared to the prior year period, reinforcing the fundamental strength of the business.
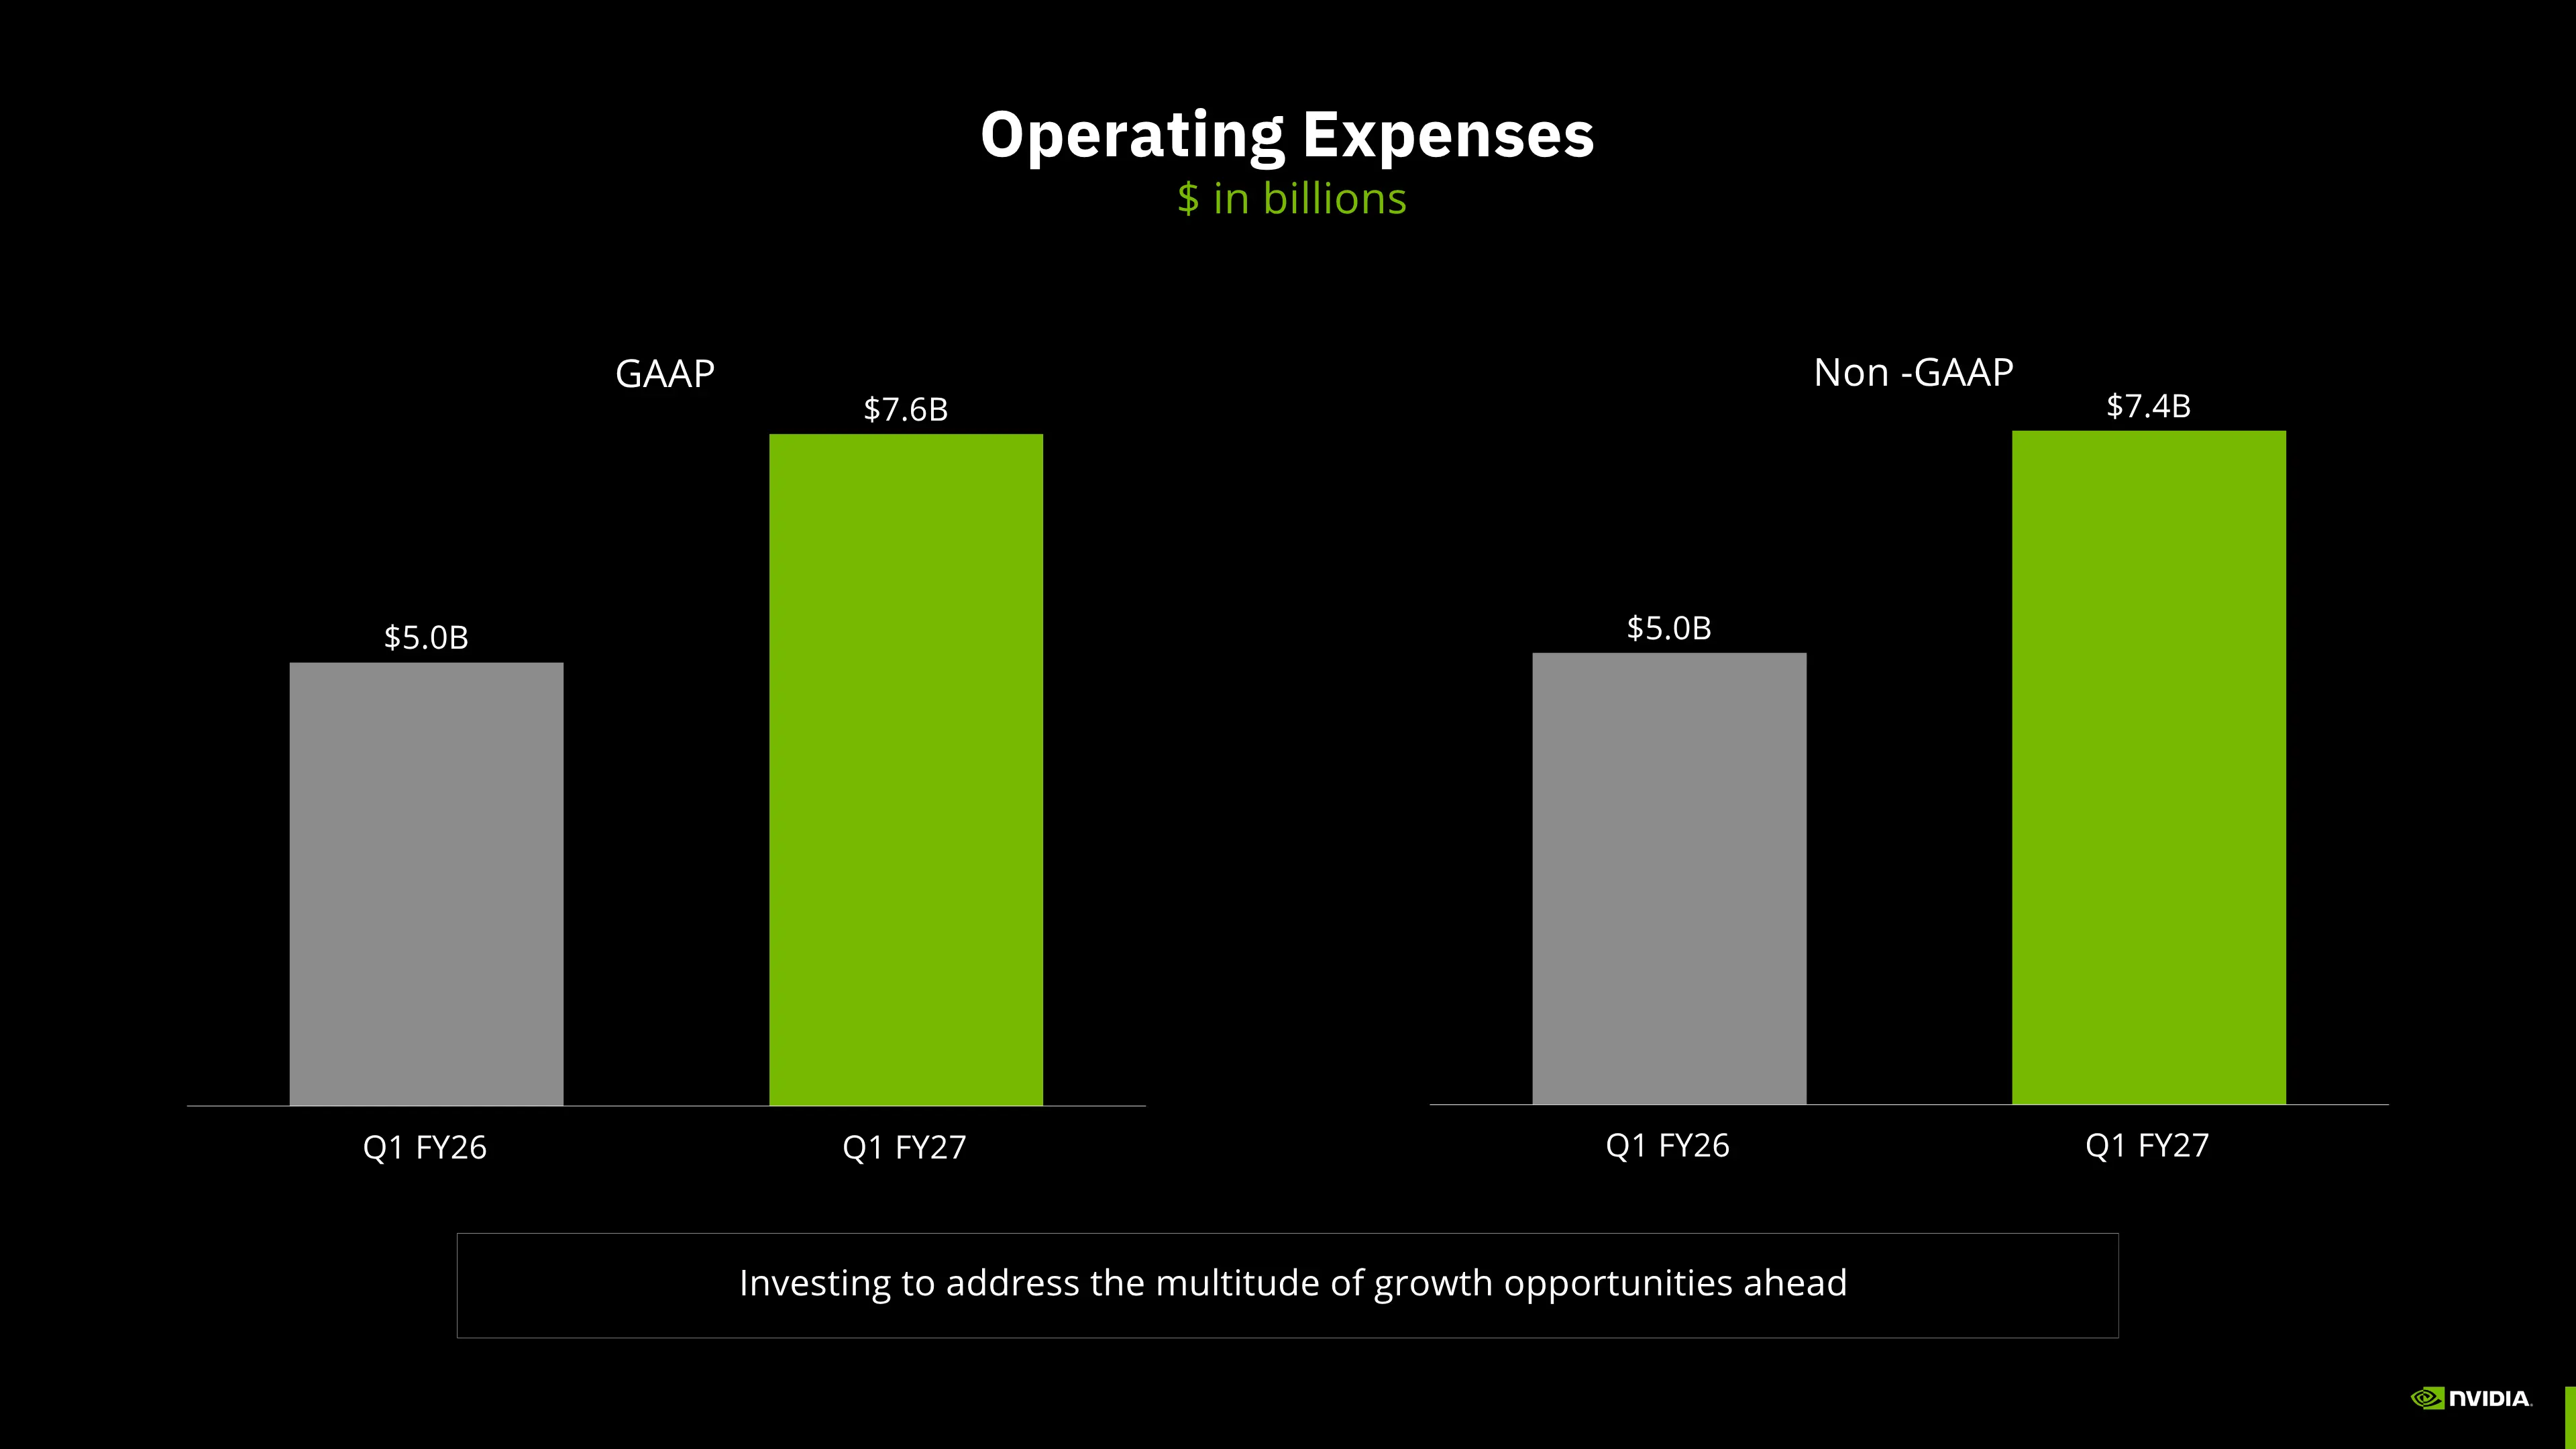
Even with surging revenues, Nvidia continues to allocate capital toward operational expansion for future technology research and development. Operating expenses increased to $7,6B GAAP to support ongoing semiconductor innovation.
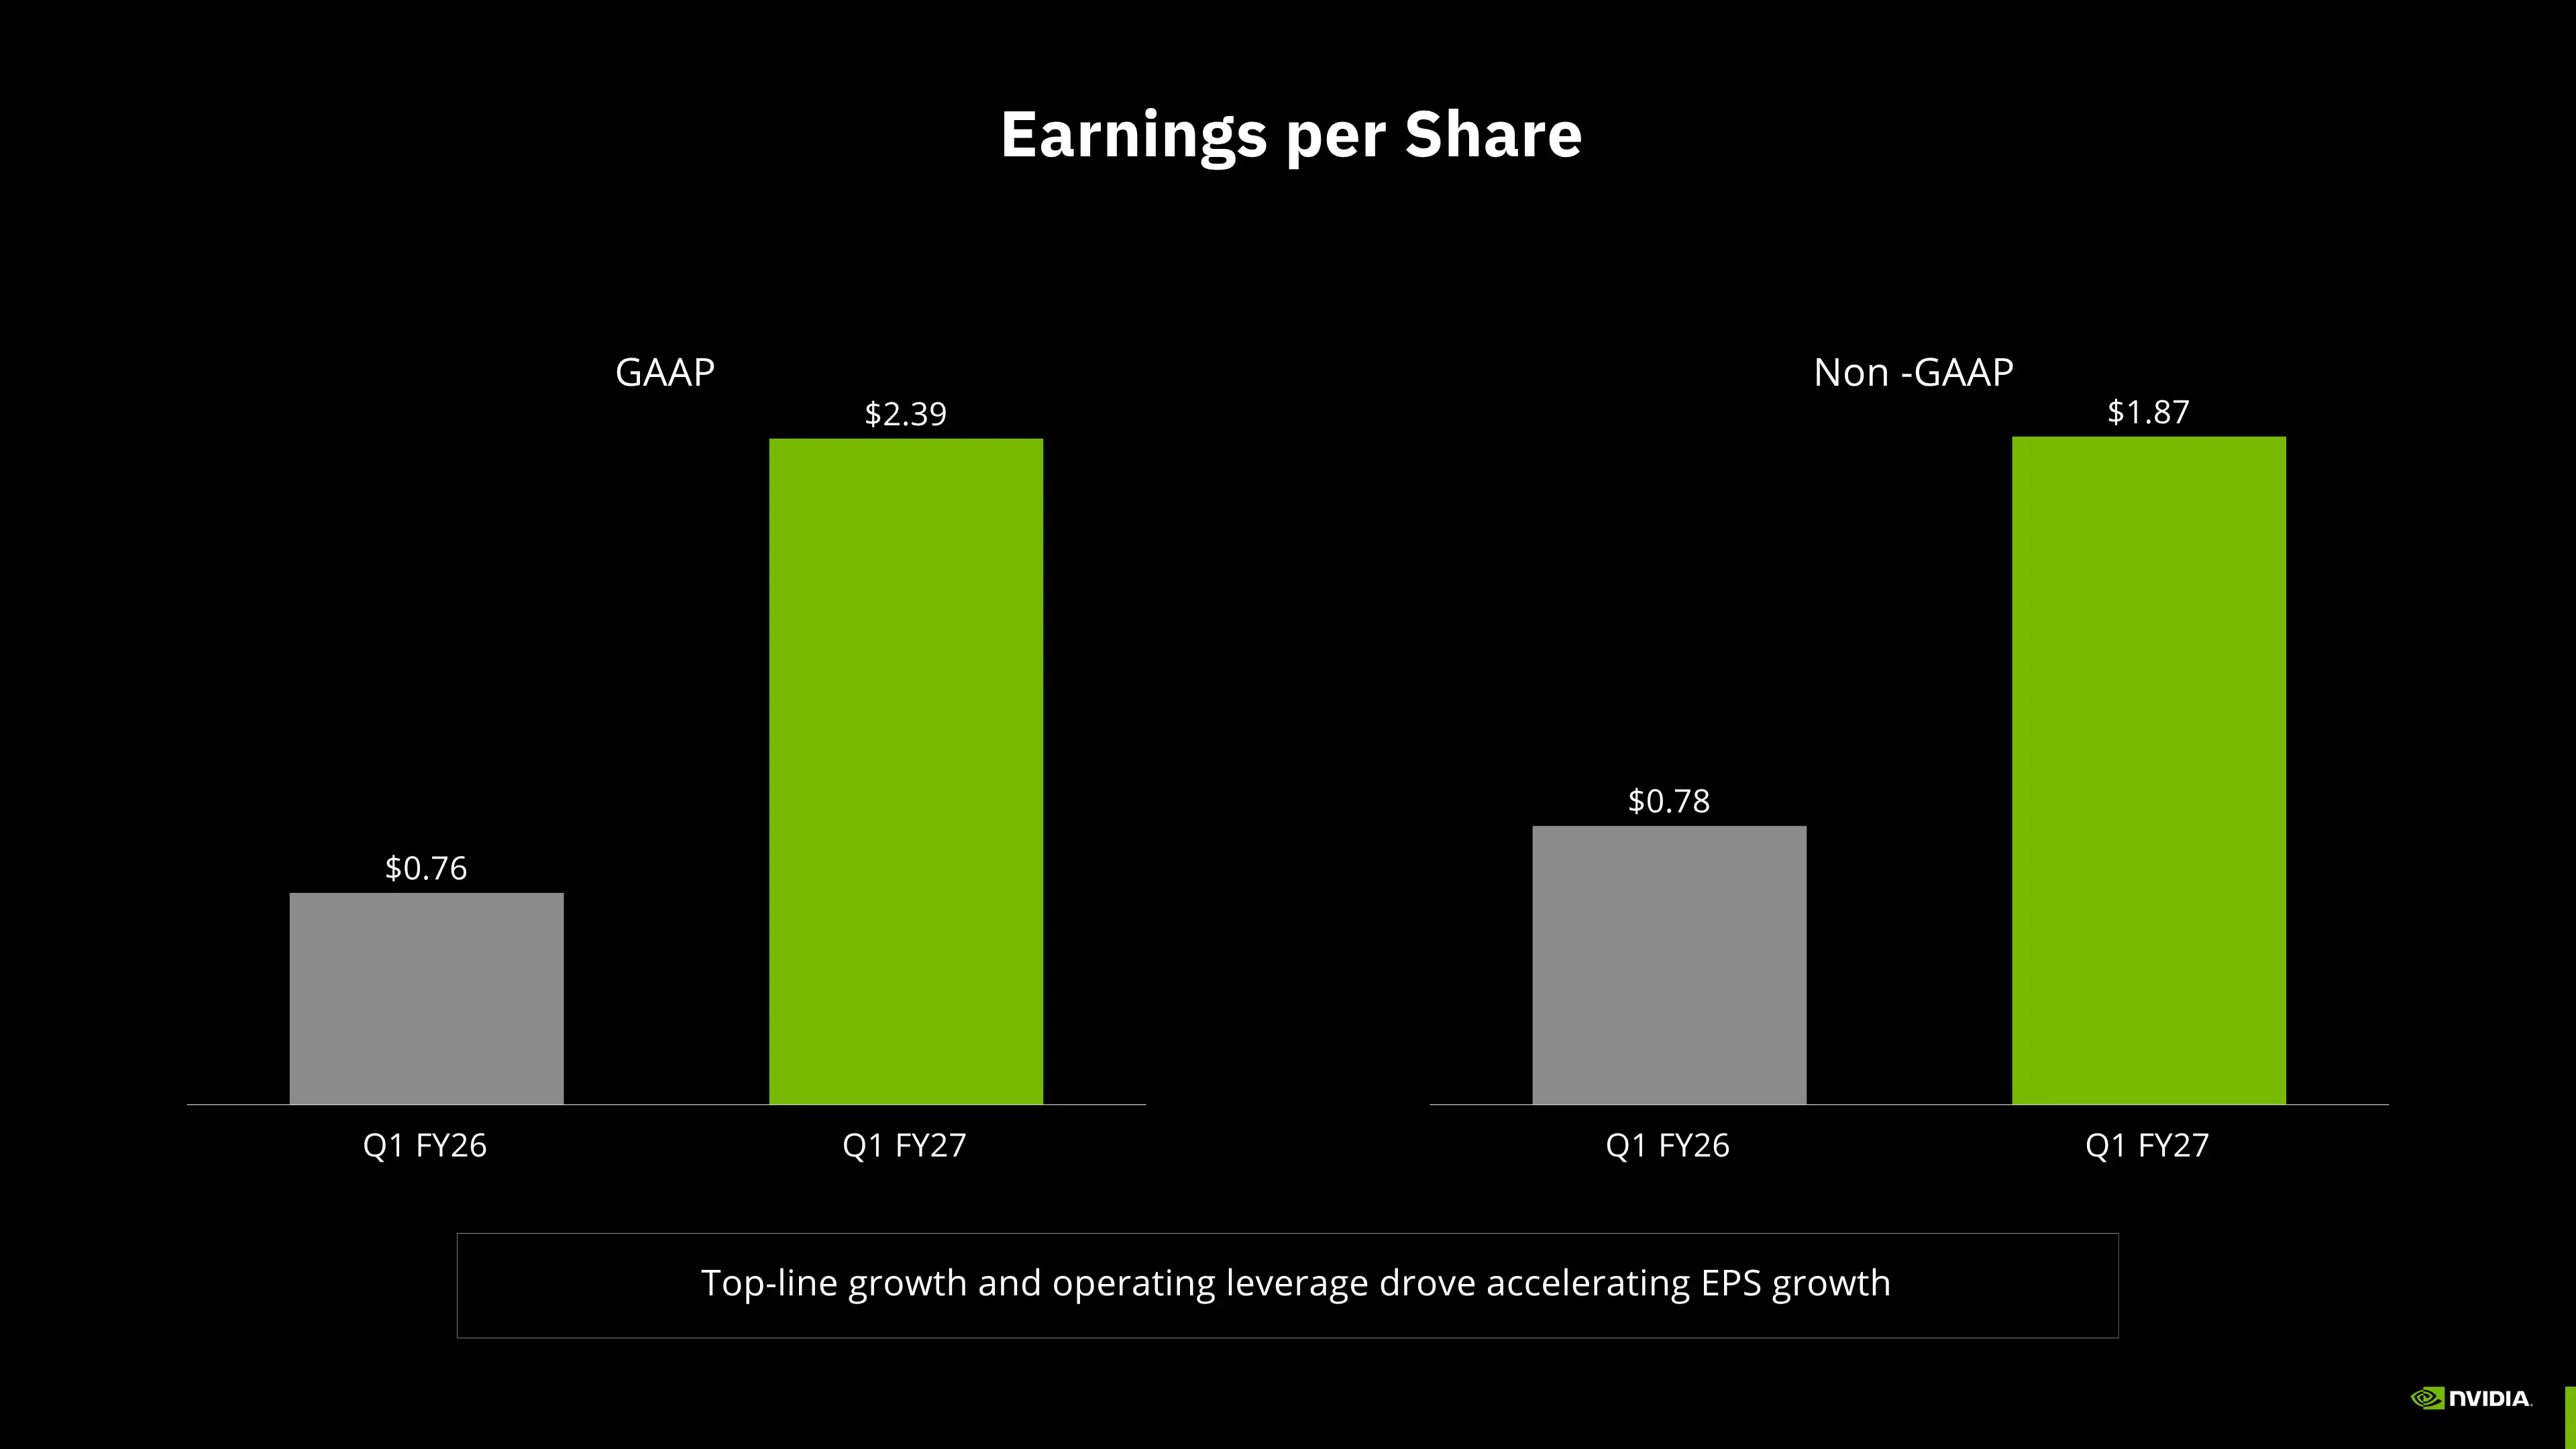
The direct result of this operational scaling lifted earnings per share to $2,39 on a GAAP basis. This substantial bottom line growth illustrates the financial leverage achieved during the period.
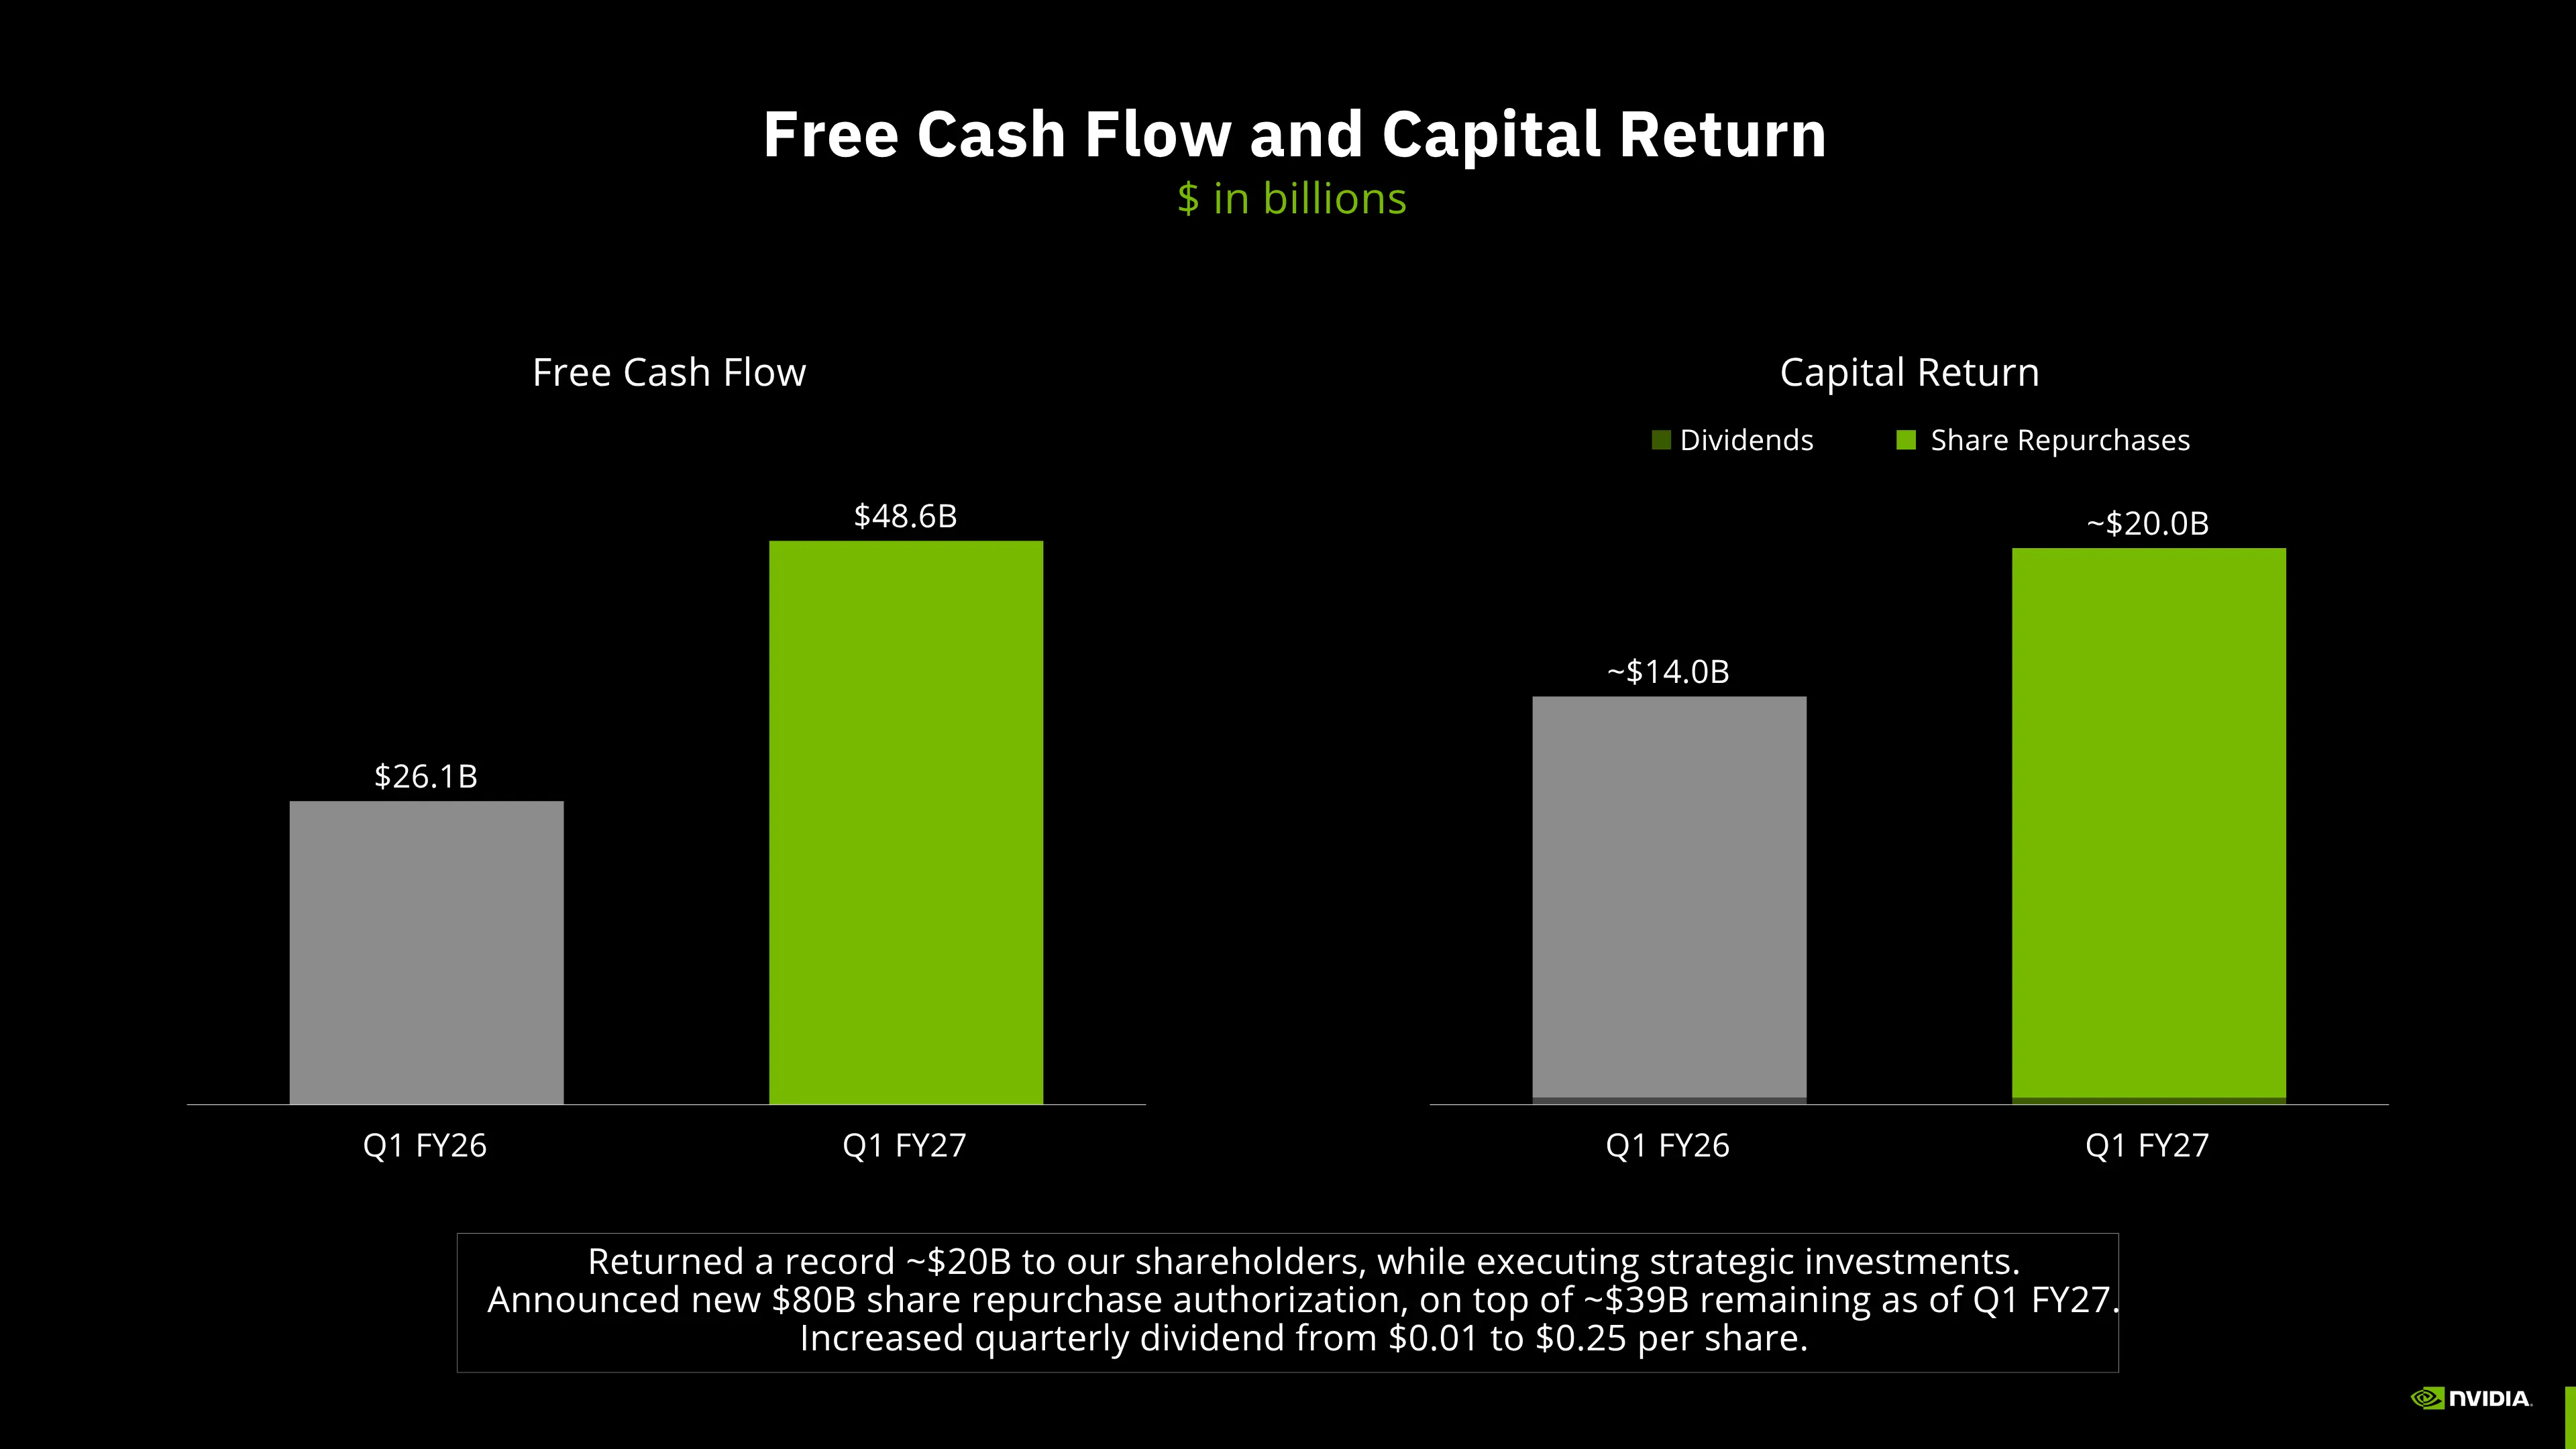
Beyond income metrics, Nvidia's Free Cash Flow reached $48,6B. Management returned approximately $20,0B to shareholders via share repurchases and dividends, alongside a new share repurchase authorization of $80B.
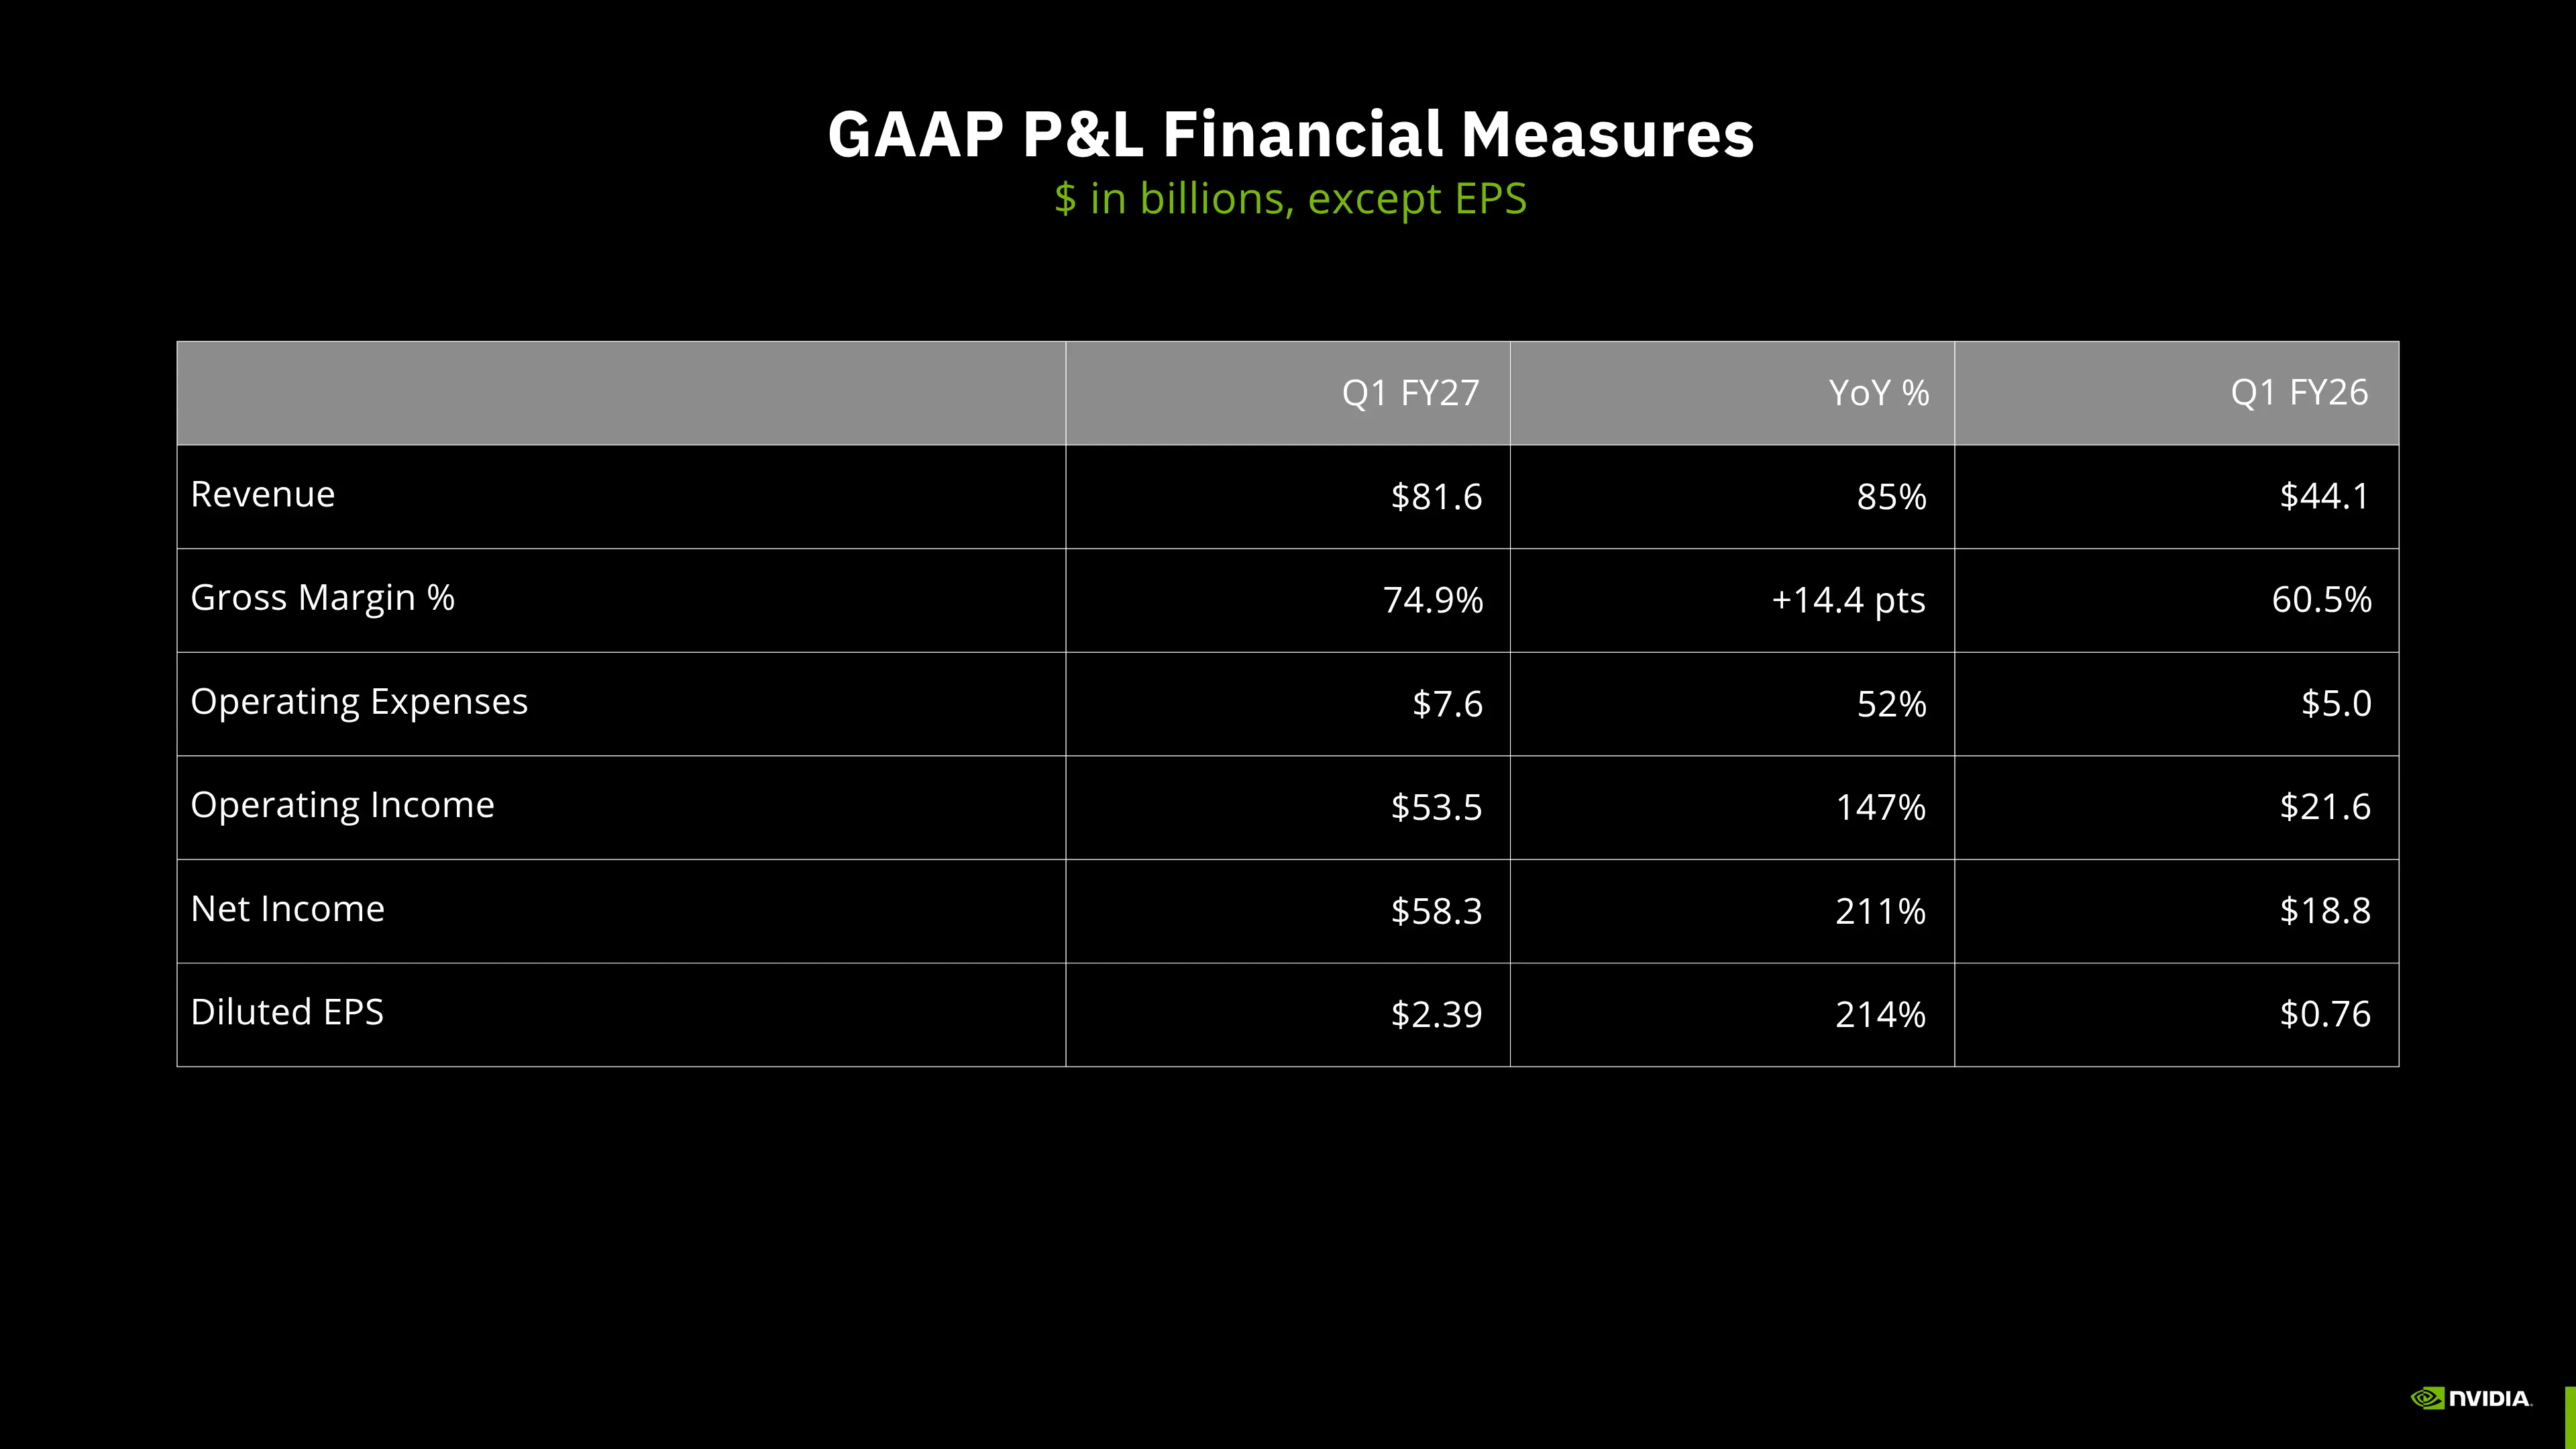
The P&L summary table above details the year on year growth trajectory, featuring an 85% revenue increase and a 211% rise in net income. All core financial indicators demonstrate substantial expansion relative to the comparative period.
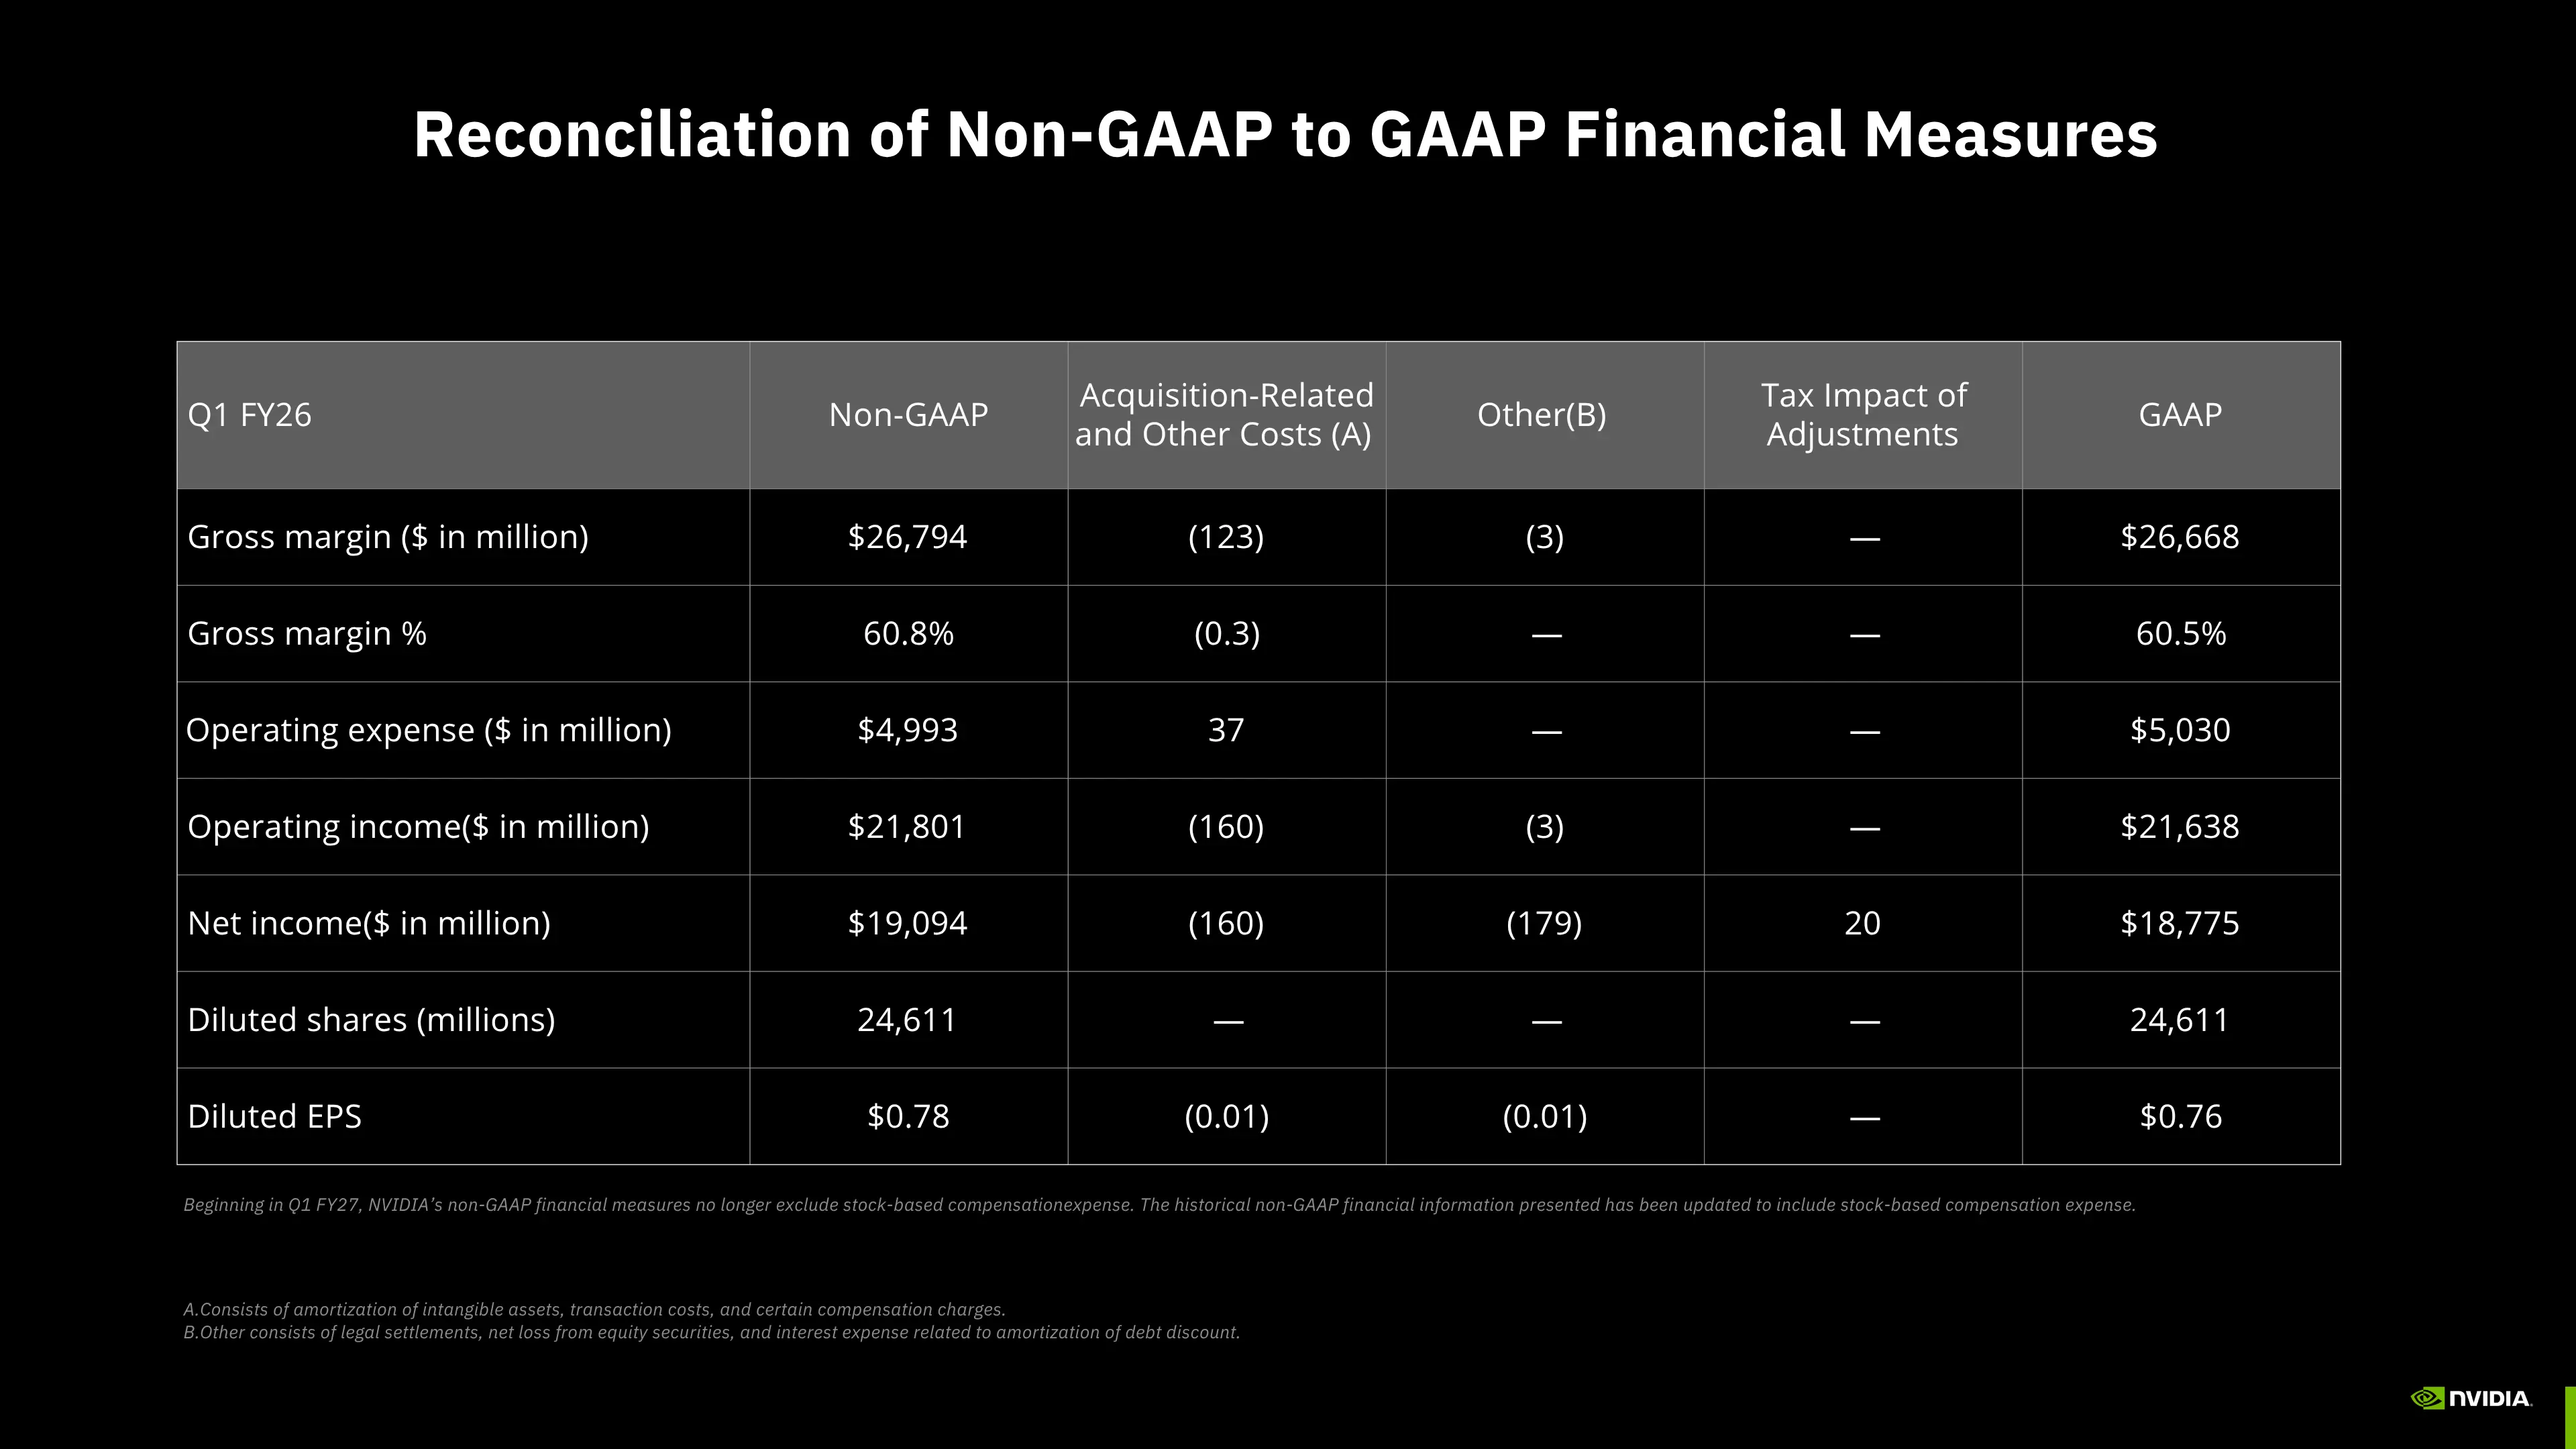
For a more granular review, the financial reconciliation table outlines the adjustments between non operating costs, amortization, tax impacts, and GAAP net income.
My opinion
From an analytical perspective, Nvidia's underlying fundamentals remain exceptionally robust within the current market environment. From a technical standpoint, following its recent upward movement, the asset may experience a retracement to test the nearest support zone around $190 - $195 before establishing its next direction. Observers generally monitor these key structural levels and broader market conditions to evaluate potential price developments.
Click here to read my authentic and original analysis
Keep trading and stay profitable📊





