
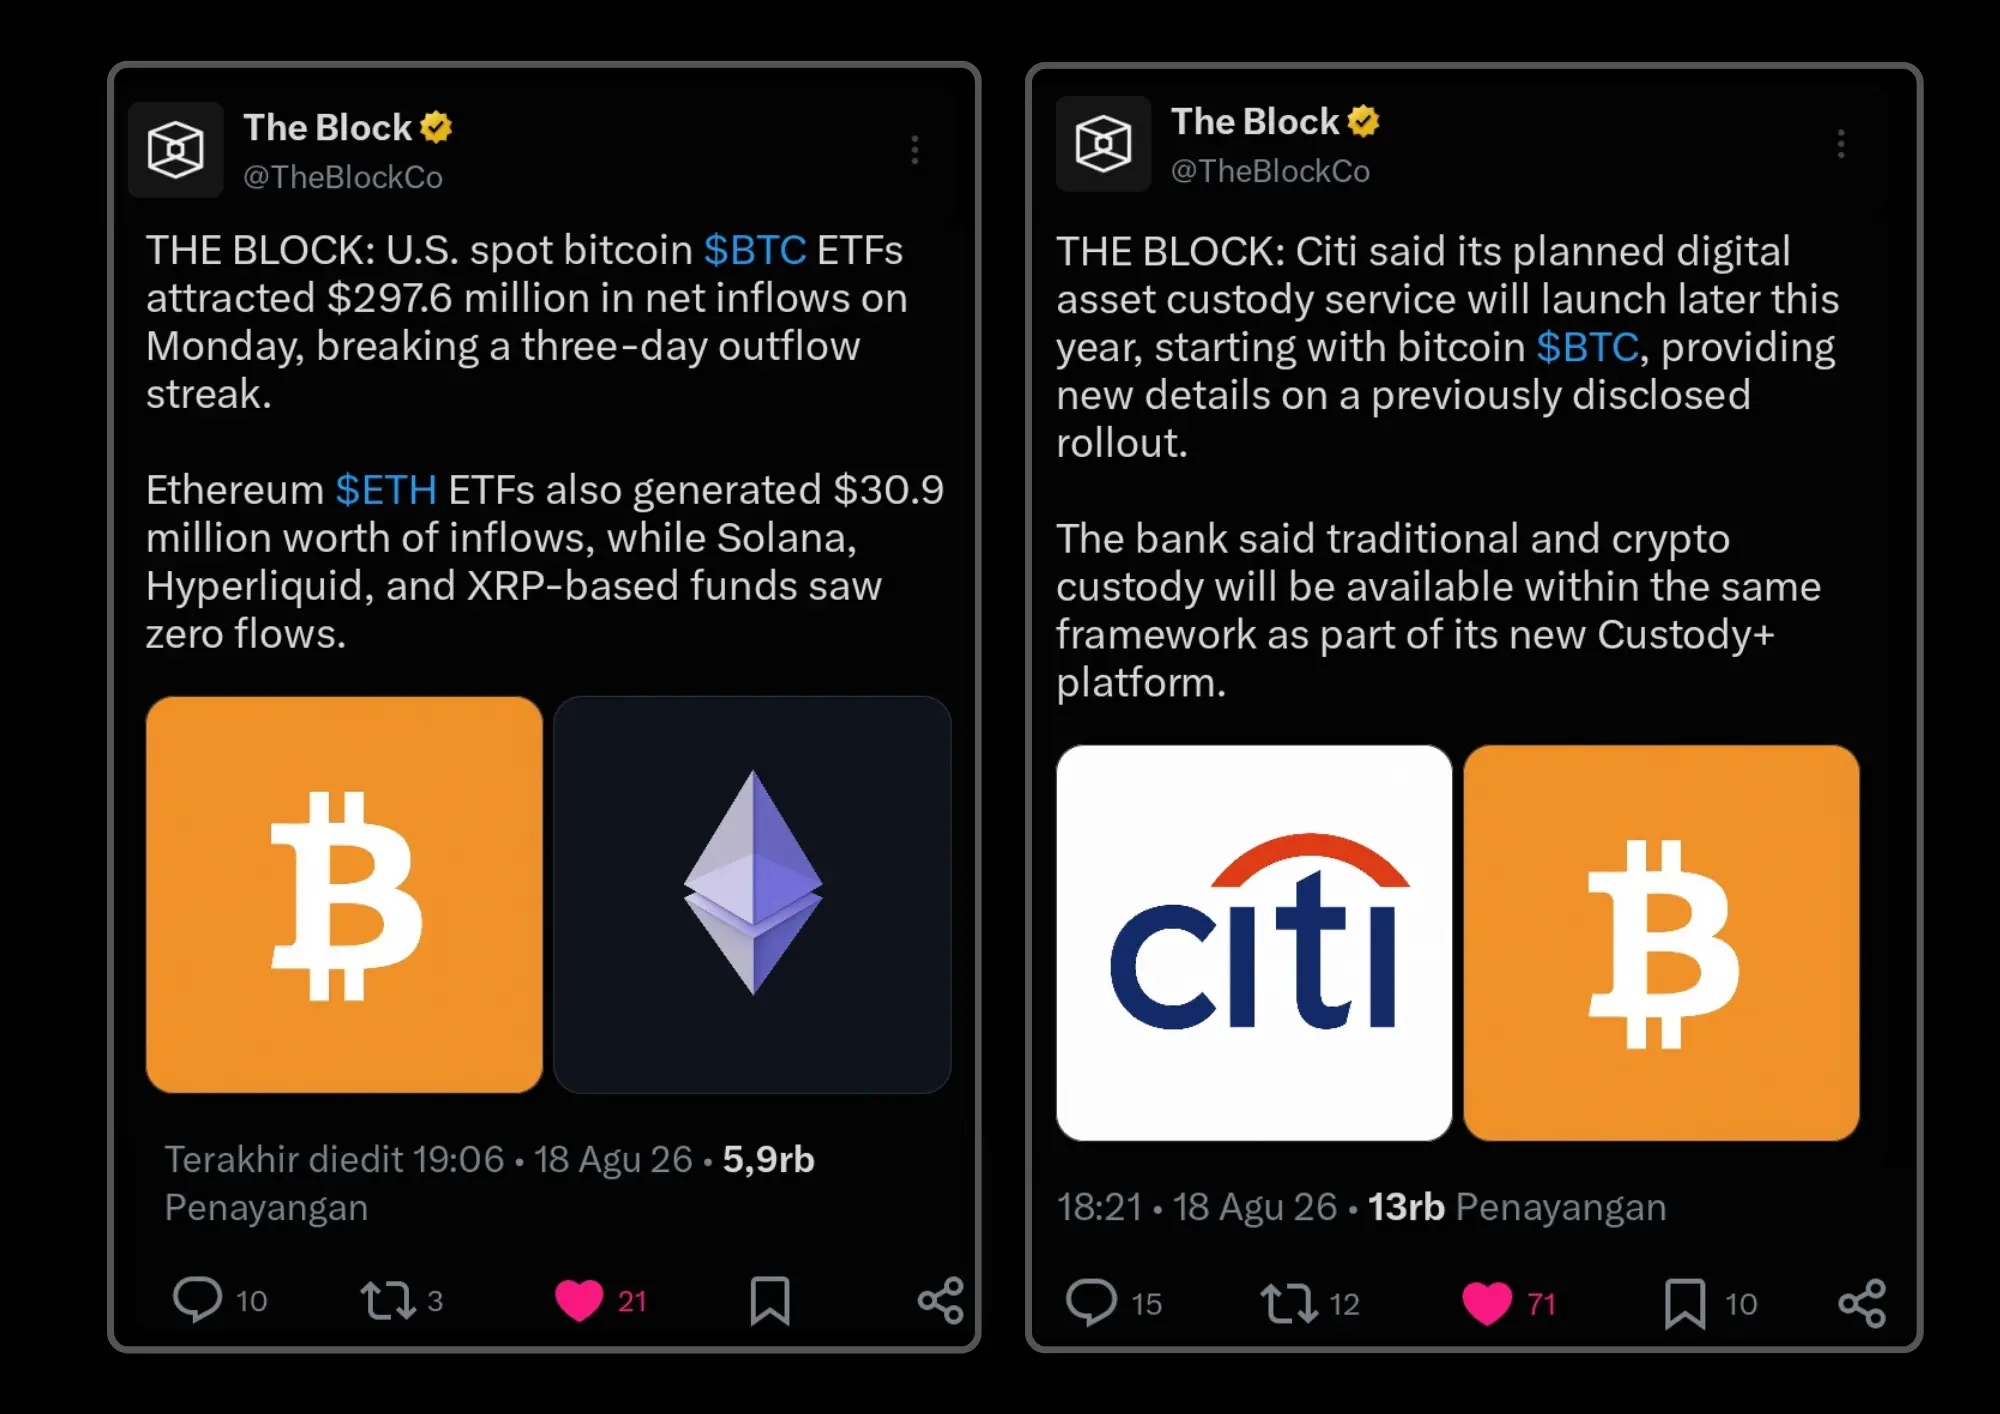
This is one of the reasons bitcoin is climbing today. Spot Bitcoin in the US just logged a net inflow of US$297.6 million on Monday, August 17, 2026, breaking a three day losing streak of outflows. Ethereum also picked up US$30.9 million in inflows, while Solana, Hyperliquid, and XRP products stayed flat with no flows at all. This lines up with the bigger picture since spot Bitcoin ETFs launched in early 2024, where cumulative inflows have already piled up into the tens of billions and become one of the main drivers of institutional adoption. For traders and investors, this is good news, since Bitcoin sitting around US$64,150 when this news broke shows the market is still relatively stable despite the selling pressure it saw the week before.
Meanwhile, banking giant Citi confirmed that its planned digital asset custody service will launch by the end of this year, starting with Bitcoin. The service will be folded into the Custody+ platform, letting clients manage both traditional and crypto assets under one roof. This move from Citi reflects how much deeper TradFi and crypto are merging, following other major banks that already offer similar services. For institutional investors, having custody from a bank as big as Citi could cut down on regulatory and operational friction, potentially pulling more capital into the crypto market over the medium term.
Where BTC and Citi stand right now
Citi's stock, after breaking out, closed with a red candle, and that was also its highest point after pushing through the resistance zone around $140.20 - $139.00. It had touched that zone before too, but ended up closing with a Bearish Engulfing pattern, and right now Citigroup is climbing slowly.
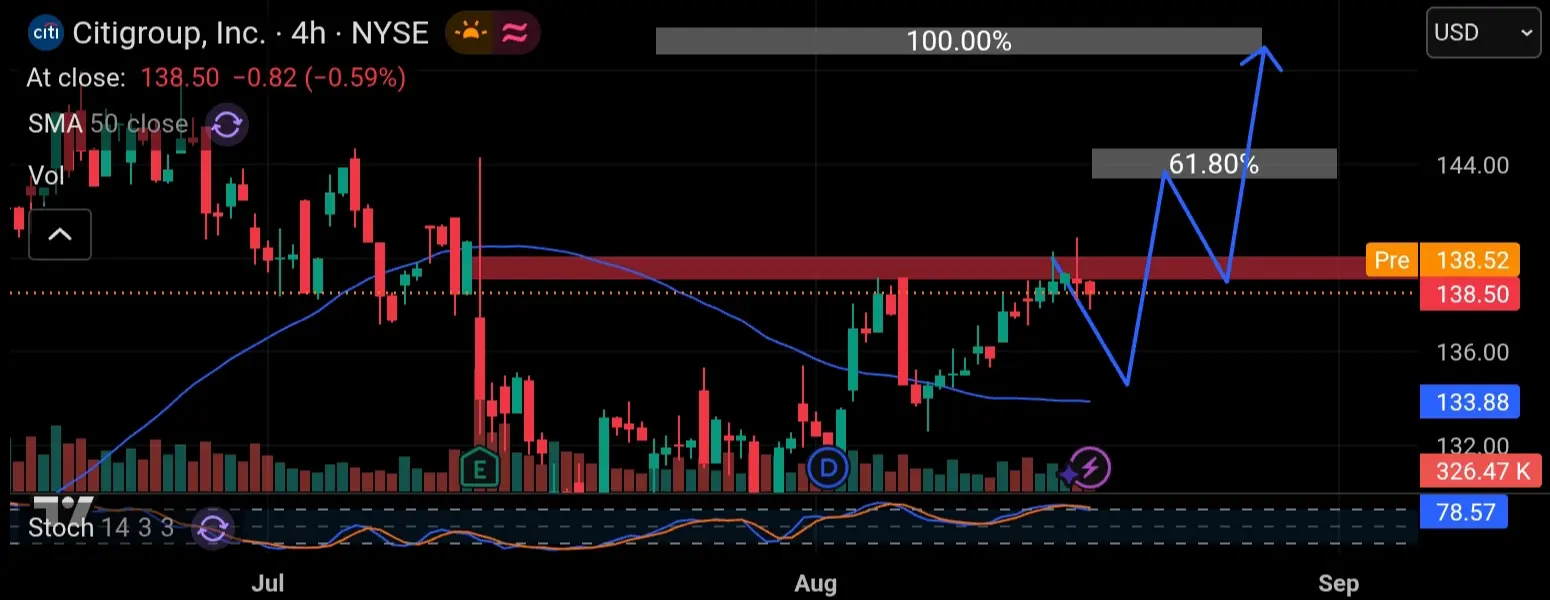
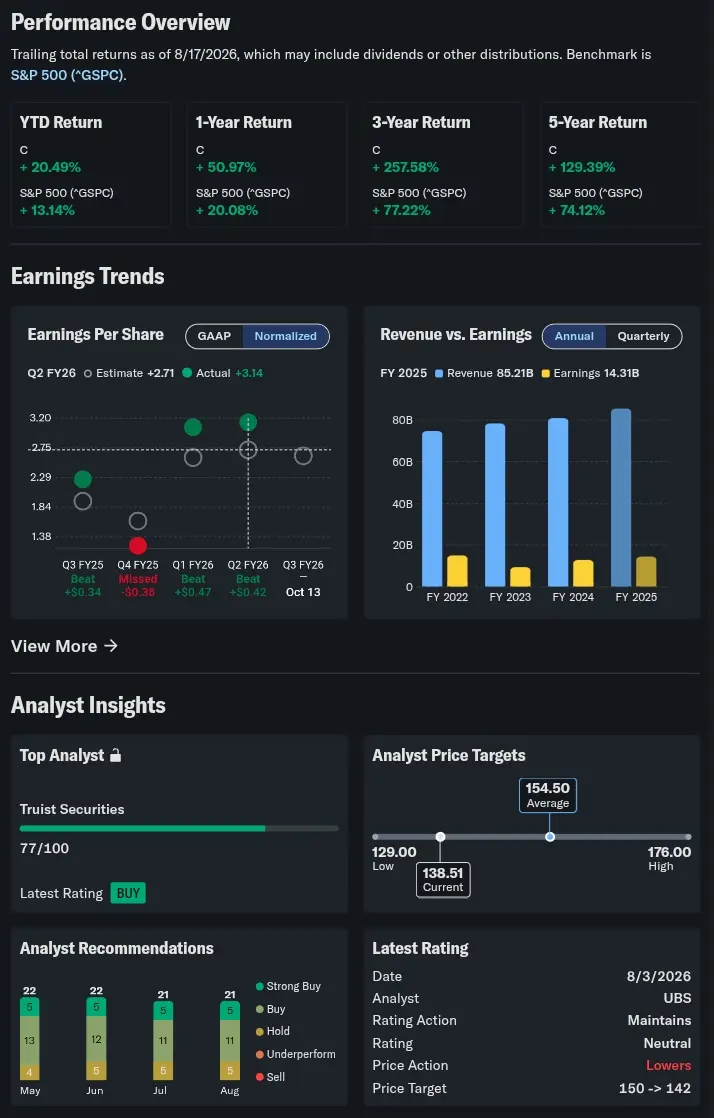
As long as the support zone around $134.50 - $133.40 holds, the bull trend stays alive. The gray zones at 61.80% and 100.00% are Fibonacci retracement levels, the 61.80% zone sits around $144.73 - $143.30, and the 100.00% zone sits around $149.95 - $148.60. It's also worth looking at yearly performance when analyzing a stock like this, since it shows we're being smart buyers. Citigroup's stock has been performing very bullishly, outperforming the S&P 500 (+20.49% YTD and +50.97% 1 Year), backed by an earnings beat in Q2 FY26 with EPS at $3.14 versus the $2.71 estimate, plus solid FY25 revenue of $85.21B. On the technical and consensus side, most analysts are still strongly bullish, with an average price target of $154.50 against the current price of $138.51, in a range of $129 - $176, though UBS did trim its target slightly to $142, which could be read as neutral.
As for Bitcoin, it's showing that the support zone around $62,885 - $62,160 is holding strong, which you can see from how the red candle dipped into that zone before a Bullish Engulfing pattern showed up on the 1 day chart. This shows the support zone and the latest news are closely tied together. With that Bullish Engulfing pattern on the 1 day chart, I'm pretty confident the resistance zone around $65,823 - $65,200 is about to get broken through, chasing after the fairly wide FVG zone around $73,330 - $67,350.
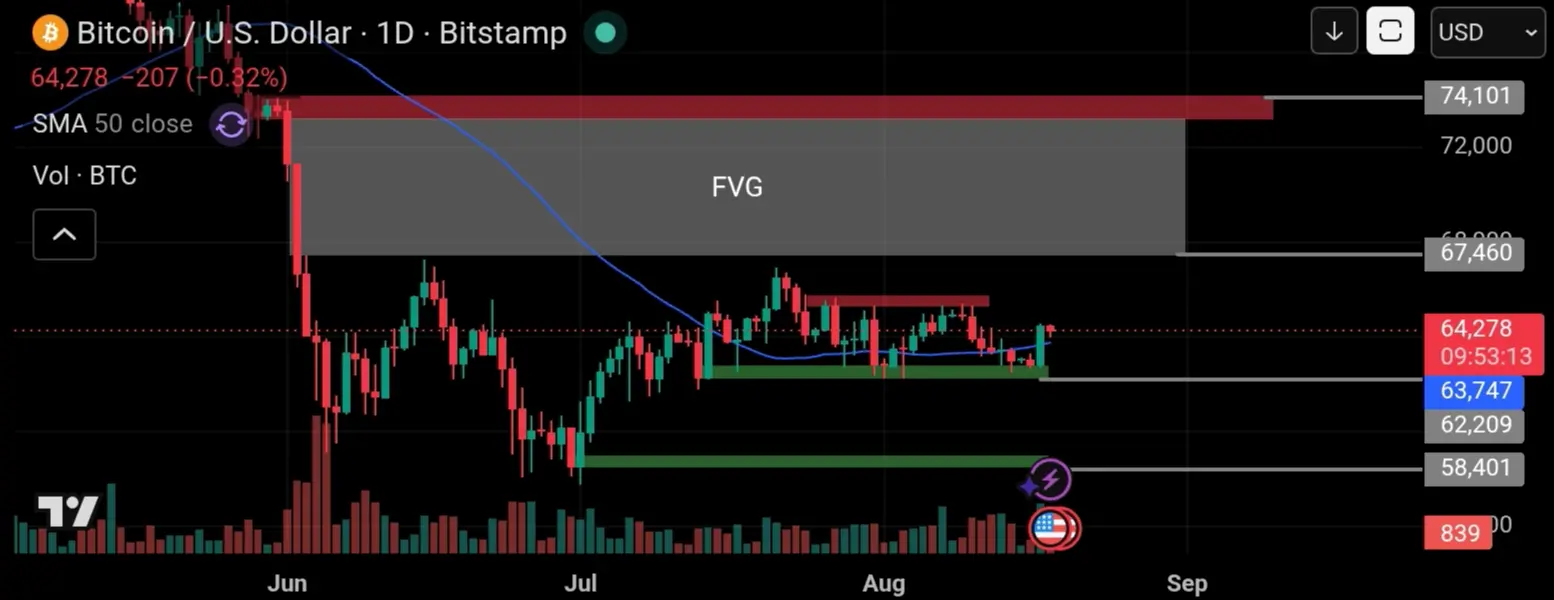
As long as Bitcoin's support zone holds, the bull trend keeps going. And for Citi's stock, it'll probably keep closing green today and tomorrow, though I've noticed that on the 1 day chart, most of its candles have been closing red. So my advice, don't jump in while the stock is already rising, buy it closer to the bottom.
Source
⛔Disclaimer - This analysis is for educational purposes and reflects personal opinion only, not financial advice. Always practice risk management and use stop losses (SL) according to your own risk tolerance.
Keep trading and stay profitable📊💪






