
Frankly, I am not a TA master. I just try.
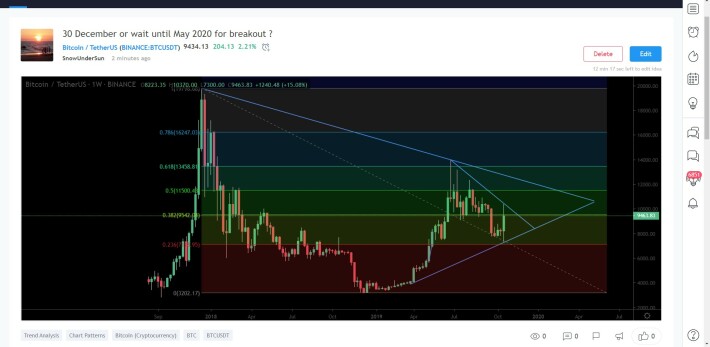
here is my weekly basis chart of BTCUSDT which I published at tradingview.
you can look entire TA in this link.
https://www.tradingview.com/chart/BTCUSDT/JyGFdlSd-30-December-or-wait-until-May-2020-for-breakout/
In long term view, we have 2 triangles.
first one will be closed at 30 december 2019 and bigger ( and most important one ) will close at 11 May 2020.
May 2020 will also be very near date to halving.
first focus is play-sideways-strategy in smaller triangle.
sell when prices come near top line of smaller triangle and buy again at bottom line.
re-buy already sold btc if break line to go up and stop loss if break bottom line.
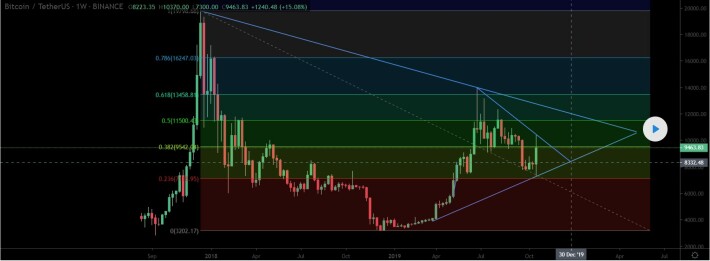
Fibonacci lines works well since 2017 bull run.
When BTC will break bigger triangle, I expect that sharp moves will follow.


