
Probabilistic forecasts allow traders/investors minimize loses and maximize profits in their trading/investment strategies. There are many methods to make forecasts (see [1-3]). In the previous posts (see [4-6]) we considered examples of how to use probabilistic forecasts to find undervalued options and maximize returns on investments with minimal risks.
In this post we consider two simple ways to make probabilistic forecasts:
-method of experts estimations;
-method based on patterns analysis of historical data.
1. Method of experts estimations
In this method, we ask experts to give us their estimations of probabilities for future prices on the specified time interval and use the arithmetic or weighted averages to make the final probabilistic forecasts. The time interval is an important parameter. It is different for different types of traders/investors. For example, for investors it can be from months to years, for position traders it can be from days to months, for day traders it can be from minutes to hours, for high frequency traders it can be from seconds to minutes.
Let us consider a simple example.
There are five experts, who gave us their forecasts for price movements on the next time interval (see table below). The arithmetic averages are shown in the last row.
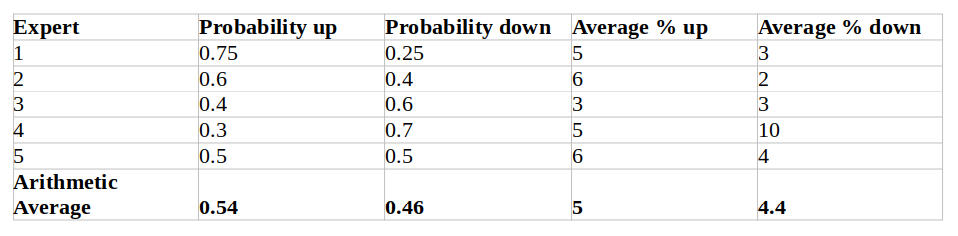
Therefore, we have the following probabilistic forecast:
Probability that the price will move up on the specified time interval =54%
Average increase in the price on the specified time interval =5% (case the price will move up)
Probability that the price will move down on the specified time interval =45%
Average decrease in the price on the specified time interval =4.4% (case the price will move down).
In this example there is a hidden assumption that all experts have the same accuracy in their forecasts. In real time situations this assumption may not be true. In such cases we need to use instead of the arithmetic average the weighted average.
To define a weight for each expert, we should look back on her/his historical forecasts and calculate an accuracy of this expert. The accuracy AC[i] (in %) for i-th expert is equal to Number of correct forecasts*100%/Total number of forecasts of this expert.
For each expert, a weight W[i] is equal to AC[i]/SUM AC[i] for all i=1,n; where n is a number of experts. The weighted average WA of some values V[i] (i=1,n) is equal to SUM W[i}*V[i] for all i=1,n.
The table below gives us an example.
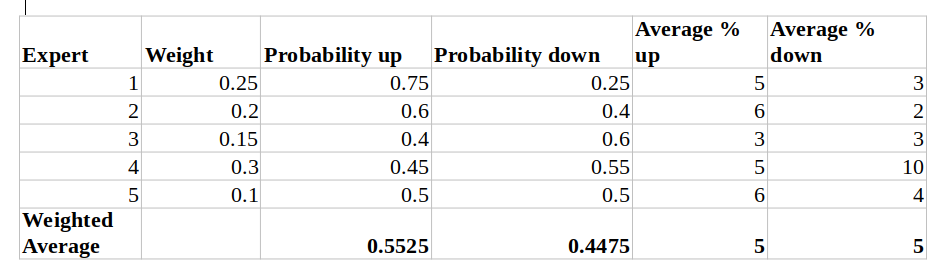
Therefore, we have the following probabilistic forecast:
Probability that the price will move up on the specified time interval =55.25%
Average increase in the price on the specified time interval =5% (case the price will move up)
Probability that the price will move down on the specified time interval =44.75%
Average decrease in the price on the specified time interval =5% (case the price will move down).
2. Method based on patterns analysis of historical data
In this method, historical data is classified on patterns. They may be patterns in charts of prices, macro economic indicators, news, etc. For each pattern statistics is calculated from historical data. From this statistics estimates of probabilities and average values are derived, which are used for the probabilistic forecast.
Suppose, we see a price chart pattern “ascending triangle” and want to make a probabilistic forecast for the next month. We look backward for similar patterns and see that there are 10 such cases. In 8 cases the price moved up and in 2 cases the price move down in the next month. Therefore, we have probability up equals to 8/10=0.8 and probability down equals to 2/10=0.2.
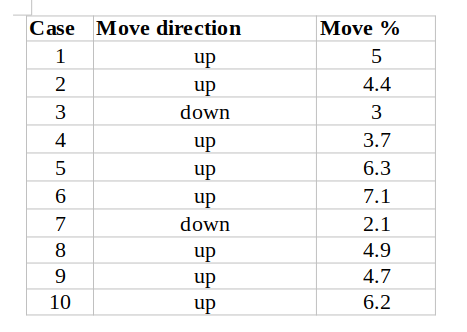
To find the average change in the price up (in %) we calculate the arithmetic average in 8 cases (where the price moved up), which is equal to (5+4.4+3.7+6.3+7.1+4.9+4.7+6.2)/8=5.29
To calculate the average change in the price down we calculate the arithmetic average in 2 cases (where the price moved down), which is equal to (3+2.1)/2=2.55%.
Therefore, we have the following probabilistic forecast:
Probability that the price will move up on the specified time interval =80%
Average increase in the price on the specified time interval =5.29% (case the price will move up)
Probability that the price will move down on the specified time interval =20%
Average decrease in the price on the specified time interval =2.55% (case the price will move down).
The same approach can be applied to news patterns. It is known fact that crypto prices are sensitive to crypto related news (see [7-8]). For simplicity of explanation, let us assume that there are only six news patterns shown in column 1 of the table below.
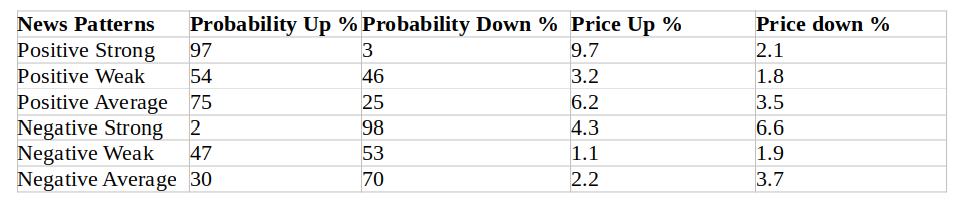
For each pattern shown in column 1, we can calculate, from historical data, frequencies of up and down price movements under influence of the news, and use these frequencies as estimates of probabilities up and down as shown in columns 2 and 3 of the table. In the same way we can estimate average changes in the price as shown in columns 4 and 5 of the table.
Probabilistic forecasts are based on the assumption of structural stability in statistical distributions.
This means, that it is assumed that statistical distributions of prices in the future will not be significantly different from statistical distributions of the prices in the past.
In some cases this assumption may not be true. Then we need to make corrections to the forecast using other methods (for example the Bayes Rule) or wait until the structural stability will be restored in markets. Fortunately, most of the time we see structural stability in statistical distributions of the prices.
In the next post we consider a simple way to generate easy recoverable Ethereum private/public keys and an address.
References
[1] How to Easily Forecast the Stock Price Probabilities (Time Series) Using IQR (Interquartile Range) in Python
[2] Forecasting future stock prices based on past performance
[3] Short-term stock market price trend prediction using a comprehensive deep learning system
https://journalofbigdata.springeropen.com/articles/10.1186/s40537-020-00333-6
[4] A simple way to make money when values of cryptos go down
[5] A simple way to increase your income when values of cryptos go up
[6] Simple optimal betting/investment strategies
[7] Influence of Good and Bad News on Cryptocurrency Prices
https://medium.com/cindx/influence-of-bad-and-good-news-on-cryptocurrency-prices-f42ff4b89fa5
[8] Bitcoin's Largest Price Changes Coincide With Major News Events About the Cryptocurrency


