In this post we perform a regression analysis of a death rate from Covid-19 as a dependent variable (Y) and an average yearly temperature as an independent variable (X) for countries for which data is available. In other words, we are looking for a function Y=f(X), that most accurately fits into the data.
Also we calculate correlation coefficients for different pairs of cryptos.
A simple way to perform this analysis is to use the online tool available at URL: https://keisan.casio.com/exec/system/14059932387562
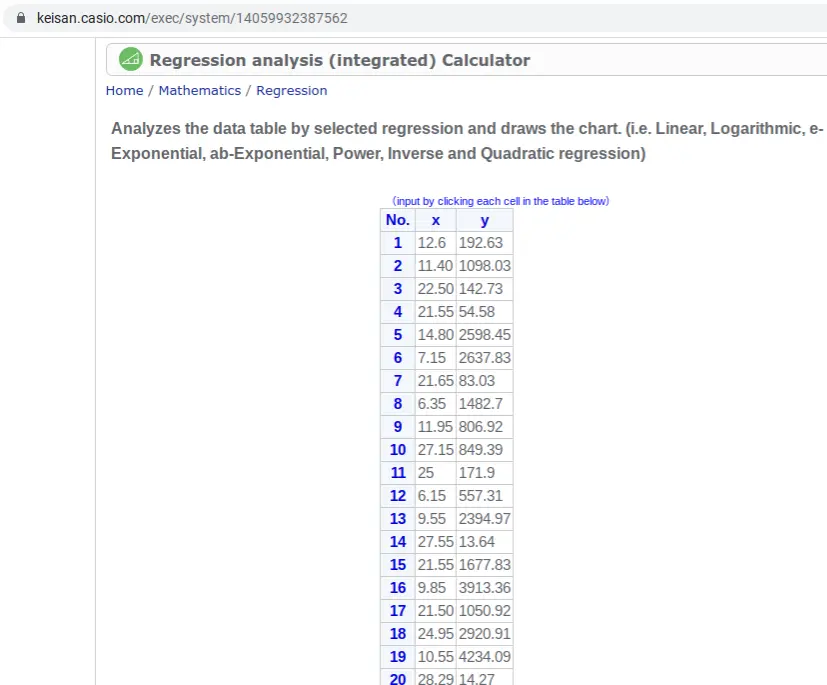
This is a free tool. It can be used without registration of a free account. But in this case, there are no options to save your data on the server and read your data into the input variables X and Y. If you register a free account then these options will be available to you.
Data for the input variables X and Y we get from [1,2].
After entering data into the variables X and Y we choose a type of regression -linear and click on the “Execute” button. The result is shown on the picture below.
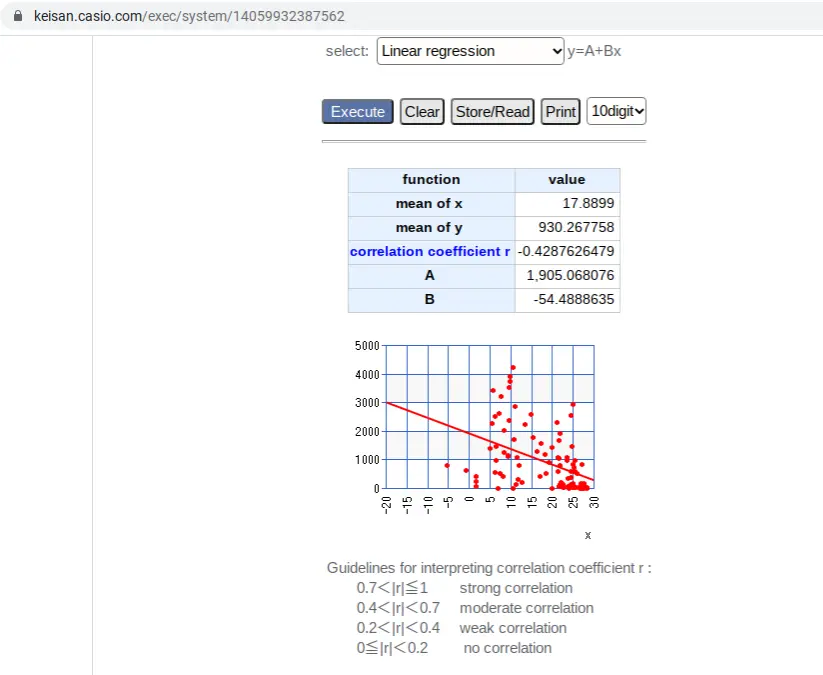
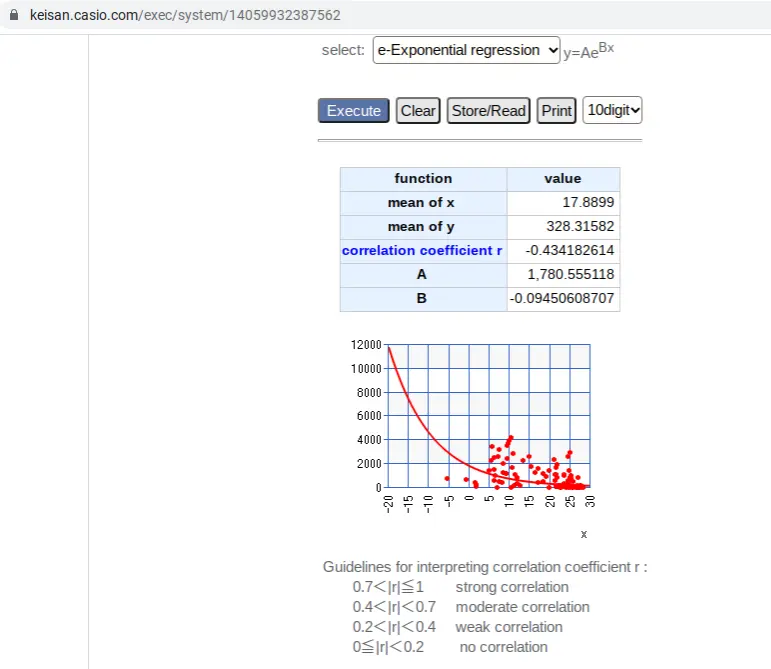
As we can see, there is a moderate negative correlation between the variables, with a correlation coefficient about -0.43. There is a causal relation between intensity of solar radiation and temperature, which explains why countries with higher average temperature have lower death rates from covid-19 than other countries. Higher levels of solar radiation are responsible for high amounts of vitamin D produced by our bodies, which strengthen abilities of immune systems to fight viruses. More details are provided in the post:” A simple way to defend yourself against multiple viruses, including covid-19”.
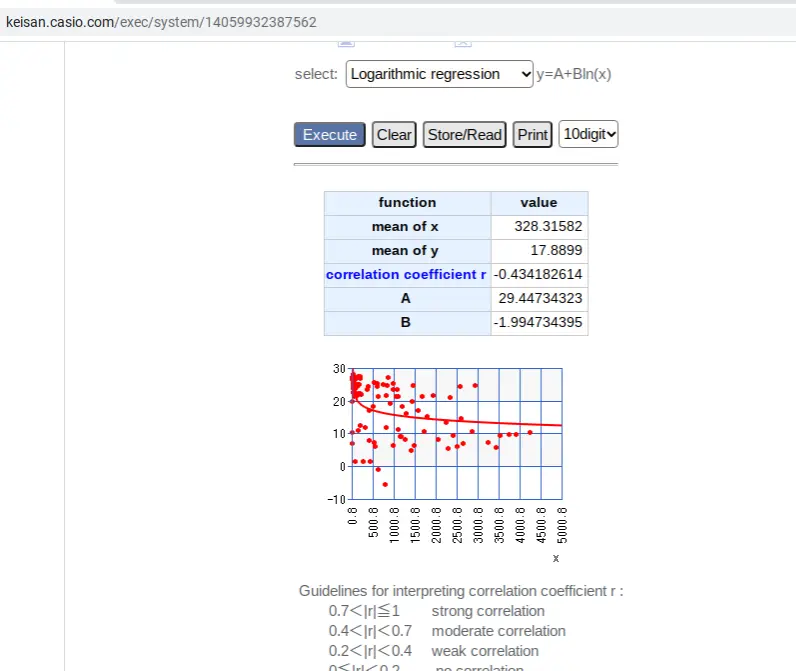
If we choose the logarithmic type of regression of temperature (X) on death rate (Y) then the output will be as shown below.
If we choose the exponential type of regression of Y on X then the output will be as shown below.
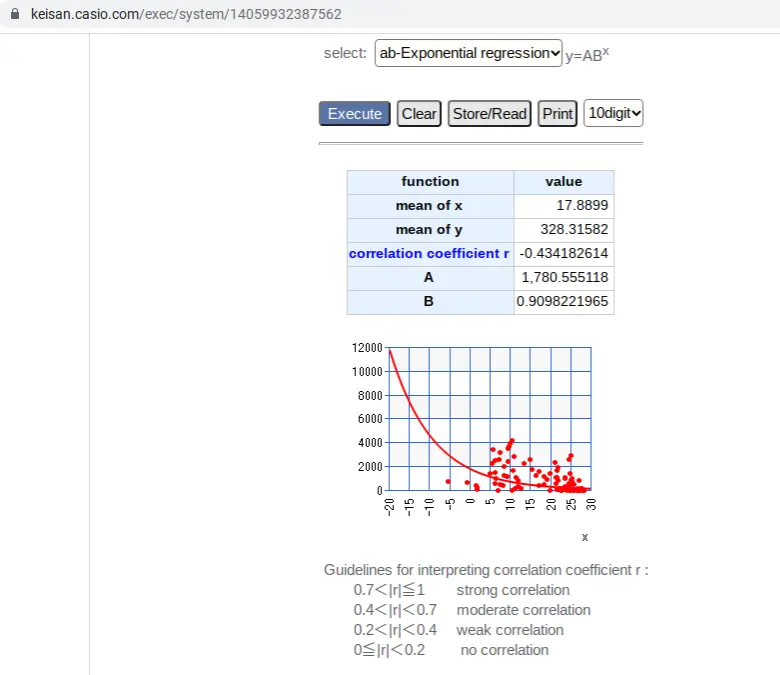
If we choose the AB exponential type of regression of Y on X then the output will be as shown below.
If we choose quadratic type of regression of Y on X then the output will be as shown below.
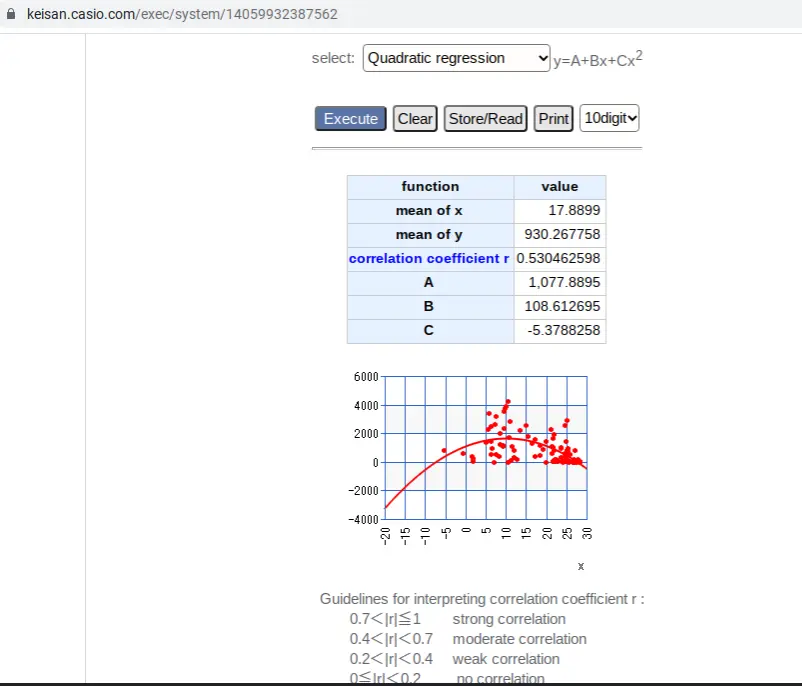
As we can see, the quadratic regression gives us the best coefficient of correlation 0.53. From the picture we see that countries with average temperatures close to zero also have lower than average death rates. In such countries bodies are adapted to extract vitamin D from diets, which strengthen abilities of immune systems to fight viruses.
If we calculate correlations among crypto currencies for different months from January 2021 to January 2022, we find that many crypto pairs are highly correlated (99%). The results can be downloaded from this link: https://www.ispreport.xyz/data/crypto.tar .
In the next post we consider simple optimal betting/investment strategies.
References:
[1] Death rates, by country

https://www.statista.com/statistics/1104709/coronavirus-deaths-worldwide-per-million-inhabitants/

[2] Average temperatures, by country

https://en.wikipedia.org/wiki/List_of_countries_by_average_yearly_temperature






