
-
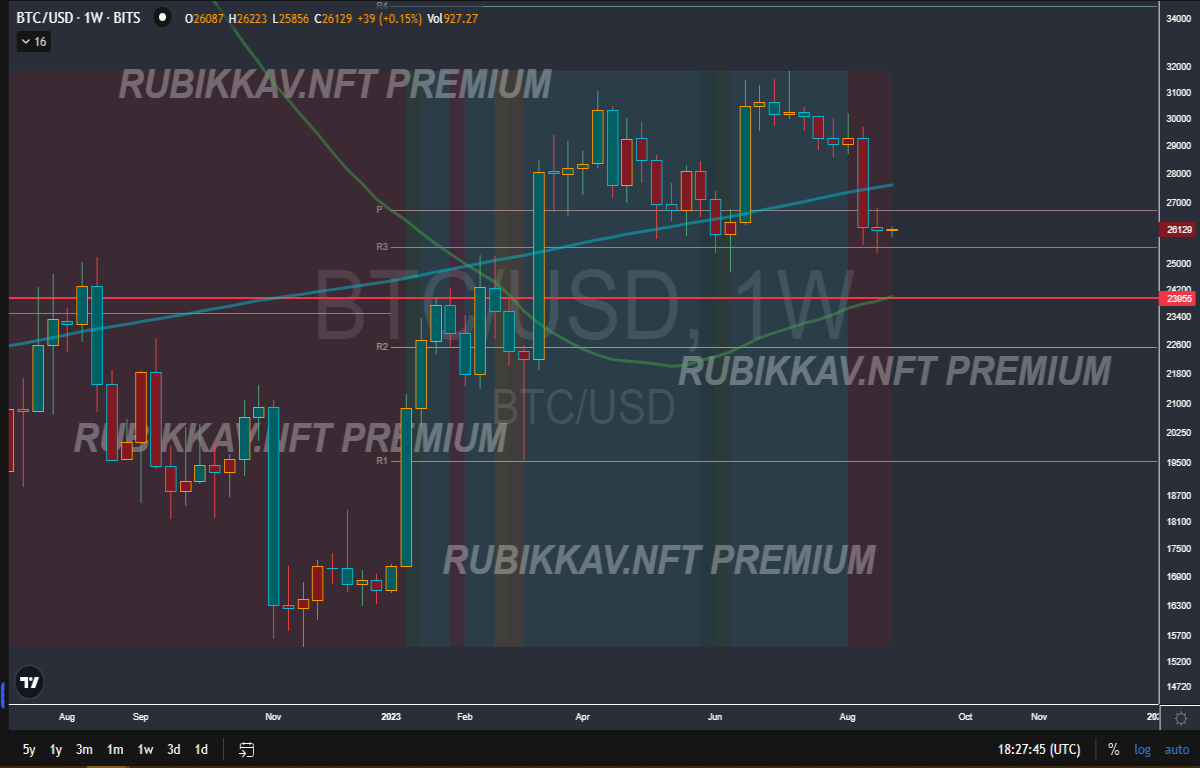
Bitcoin and Ethereum continue without any relative movement. Little liquidity, volume and bearish sentiment promise an upcoming price correction.
-
Digital assets such as Litecoin, Binance Coin, Optimism Network and among others, seek the average weekly price ratio in order to remain in definitive support.
We are a few days away from the August monthly close for the cryptocurrency market. Many traders expect Bitcoin to decide whether to enter an accumulation period or go to touch the 50-weekly SMA at exactly $23,994.51, after breaking the exact resistance point of $25,535.47.
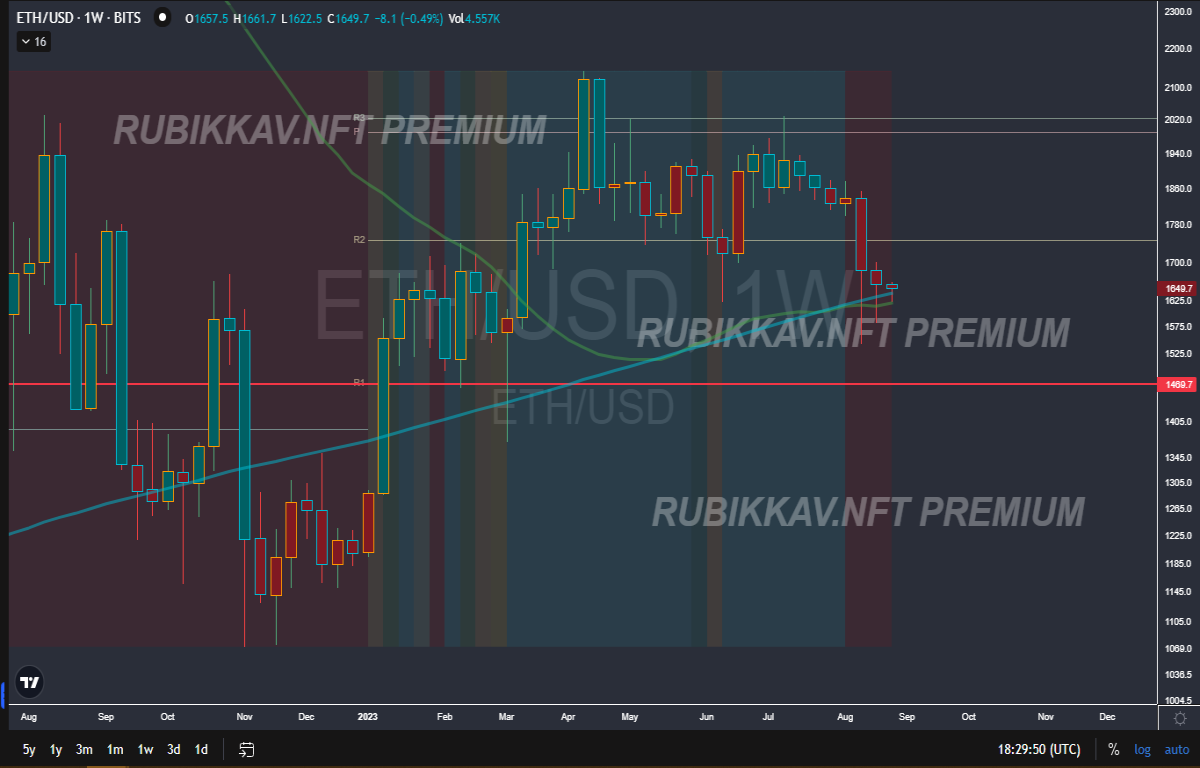
For the case of Ethereum, and for the majority of market players, you want your correction to start from the power price of $16020.3 and follow the trend towards the midpoint of $1469.7. The above is somewhat negative, but for both cases it is what will generate liquidity in the market in the coming days.
Anyway, this weekly report does not seek to generate negative or positive controversies. Rather, for this report we want to make known the cryptocurrencies that we can be observing and not caring if they are going to be good for the bulls or negative for the bears or vice versa.
Working Out For The Next Run
Following the recent Halving and according to CoinTelegraph report, Litecoin faced considerable decline and rejection of support levels. From August 17 to 25, it has remained in the $65 band with an average weekly support at $59.61. From our point of view, this digital asset is preparing for the next shark run.
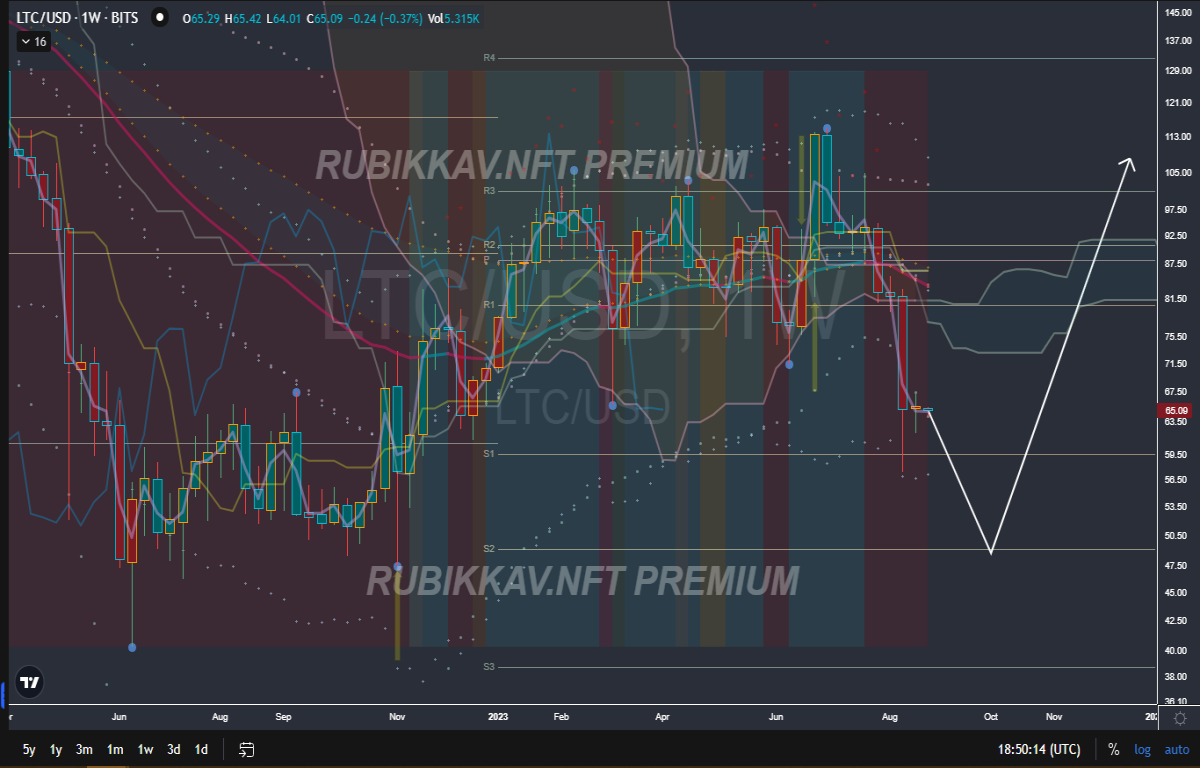
The report also reveals that the indicators show that the price resistance for Litecoin is at $84.48 for the last 20 days. However, the RSI indicator also shows an oversold asset.
In addition, the volatility index registered by Santiment shows how it has catapulted from 0.038 to 0.112 since August 17, which shows clear instability in the price of the crypto asset.
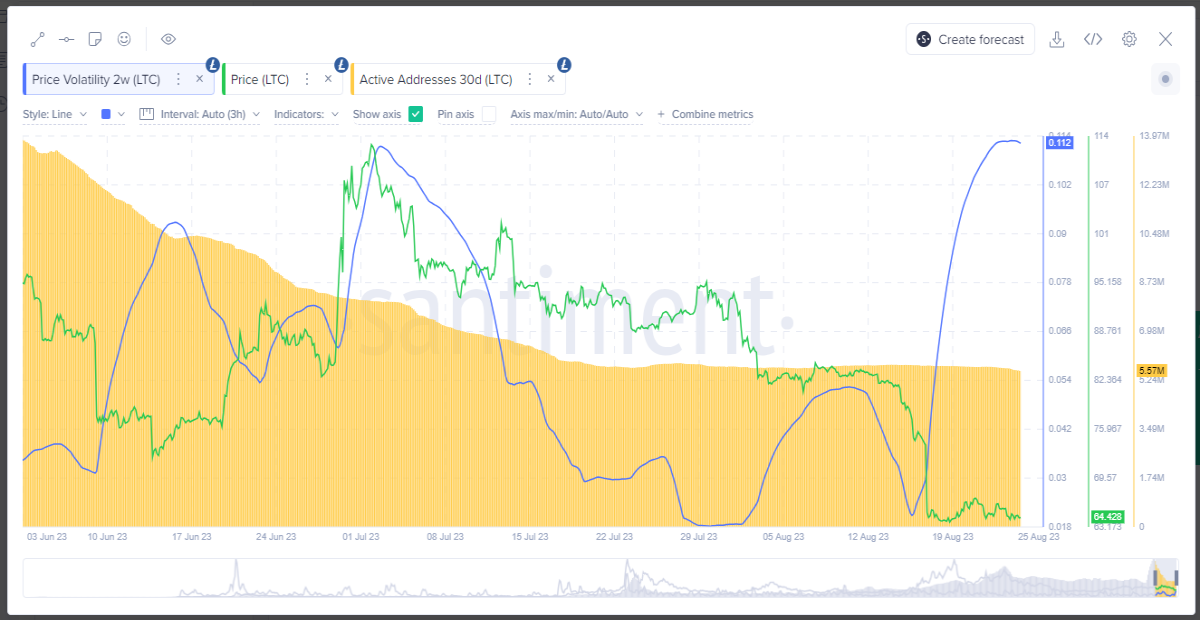
The data also shows a decline in on-chain wallet interaction, falling from the introduction of the LTC-20 standard, which saw an estimated 14 million active wallets per day, to currently 5.5 million wallets per day.
Liquidity Resilient Derivatives
Rumors continued to swirl this week as Binance Coin (BNB) bounced off of $200, a level of support that has held for over two years, only broken briefly after Terra’s collapse, according to the Kaiko opinion.
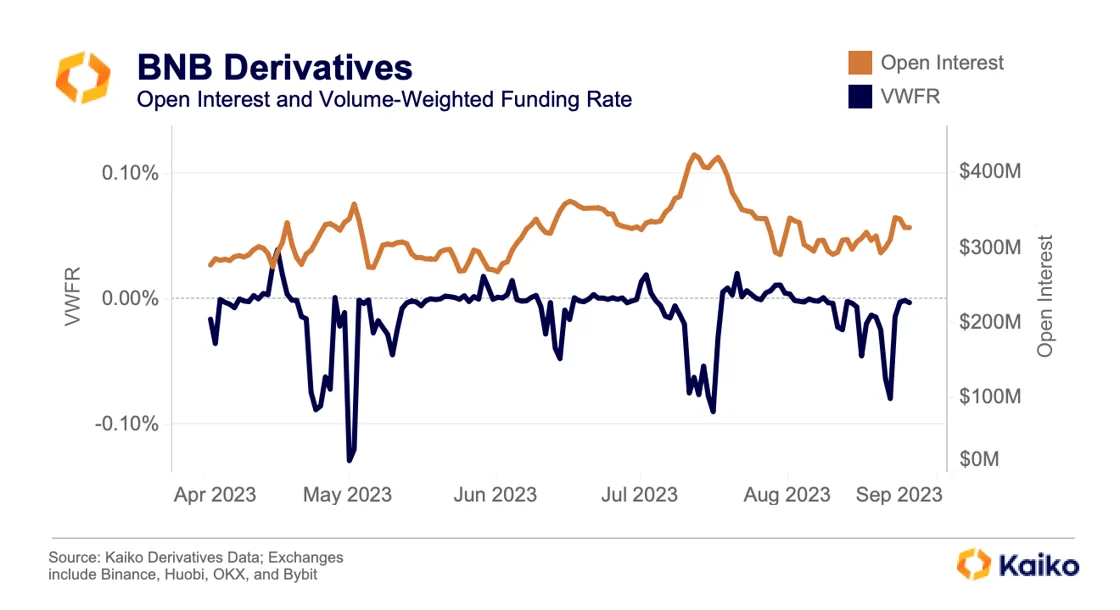
However, liquidity has remained strong, it says the report and additionally, derivatives data shows that aggressive shorting of BNB has subsided, at least temporarily.
The reality is that many market experts expect that Binance Coin (BNB) will remain at a cheaper price in the coming months. We outline that demand zone below $181.94 and $149.78 for the moment, in case the bears take control.
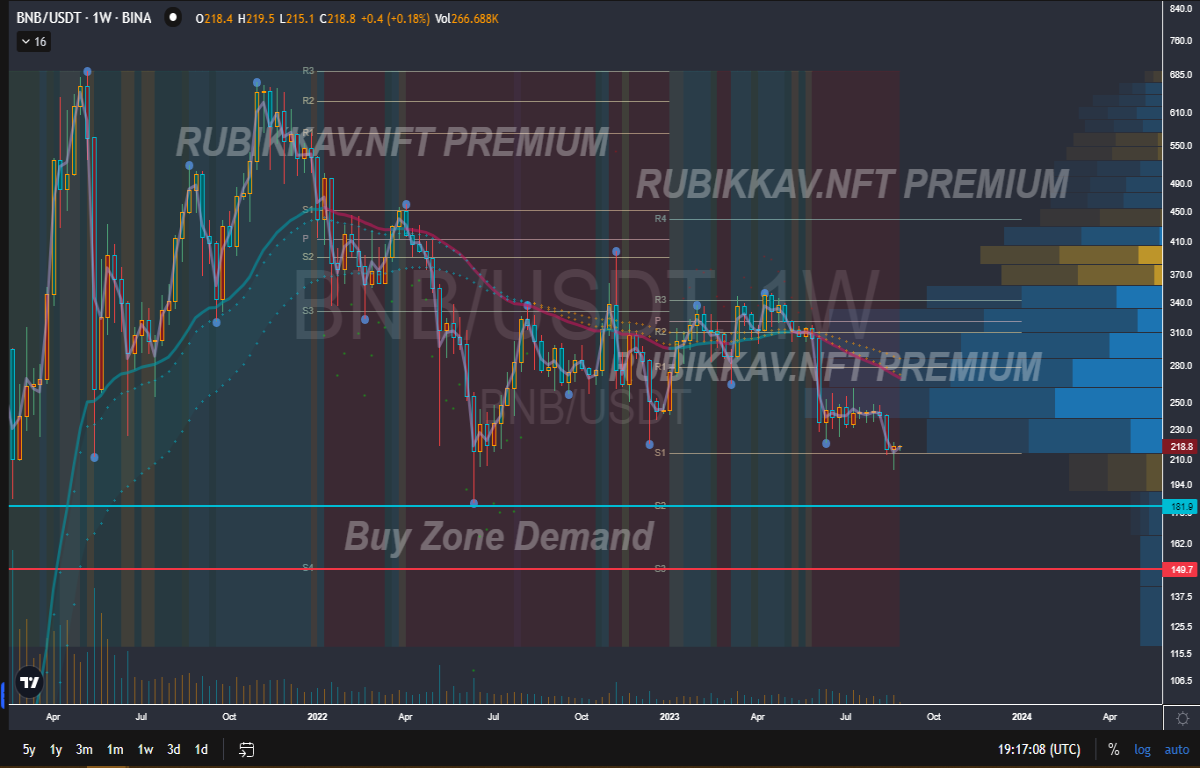
For the bulls, it will be necessary to create a comprehensive accumulation in the mid region between $214.74 and the break of $244.85. However, there must be a large volume of demand above the resistance of $269.51 to consider a safe bullish entry.
Optimism To Buy
OP may have broken the daily market structure to the downside in mid-August's aggressive drop.
Suppose bulls can hold support near $1.4333, which is August 17th's accumulation on the daily chart after bulls filled July 13th's daily gap. In that case, the odds increase that this apparent market structure break was instead a stop run before consolidation or a move higher.
A drop through this level might test a broad area between $1.3676 and $1.2952. Bulls rejected bears on August 17th at the high of this zone. The middle of this zone is the midpoint of August 17th's wick that filled a daily gap.
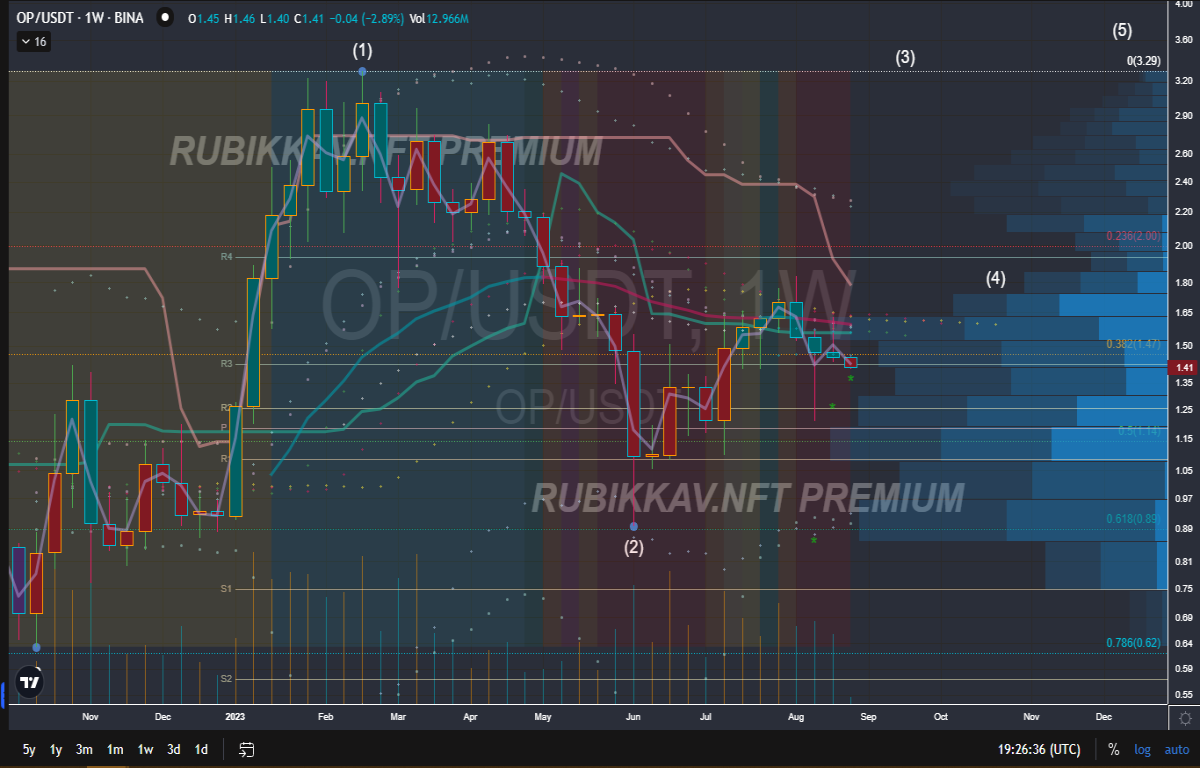
However, resistance is nearby and may prompt consolidation or a break of support as traders sell the news of Monday's mainnet upgrade. Resistance begins in August 26th's distribution at $1.4438, and bears are likely to hold this level if they plan a more significant selloff.
If this resistance breaks, the upside target is a daily gap beginning at $1.4998. The 18 and 40 EMAs are converging near this level.
If the price seeks to rebalance this gap, it could reach higher into August 24th's daily distribution near $1.5239 - although a move to this level might suggest weakness from bears.
No Reason For Reversal
GNS plunged nearly 37% from its early-August high, pushing below the summer range's lows.
There is no price action below the current price to suggest support. The 100% extension of July 13th to 25th's downward move might indicate an area of possible support at $3.1080 - approximately $3.200 to $3.000.
Resistance is nearby and may begin in August 26th's daily gap. A move into this level could reach as high as $3.5304, where distribution on August 23rd overlaps with August 25th's daily gap and the 9 EMA.
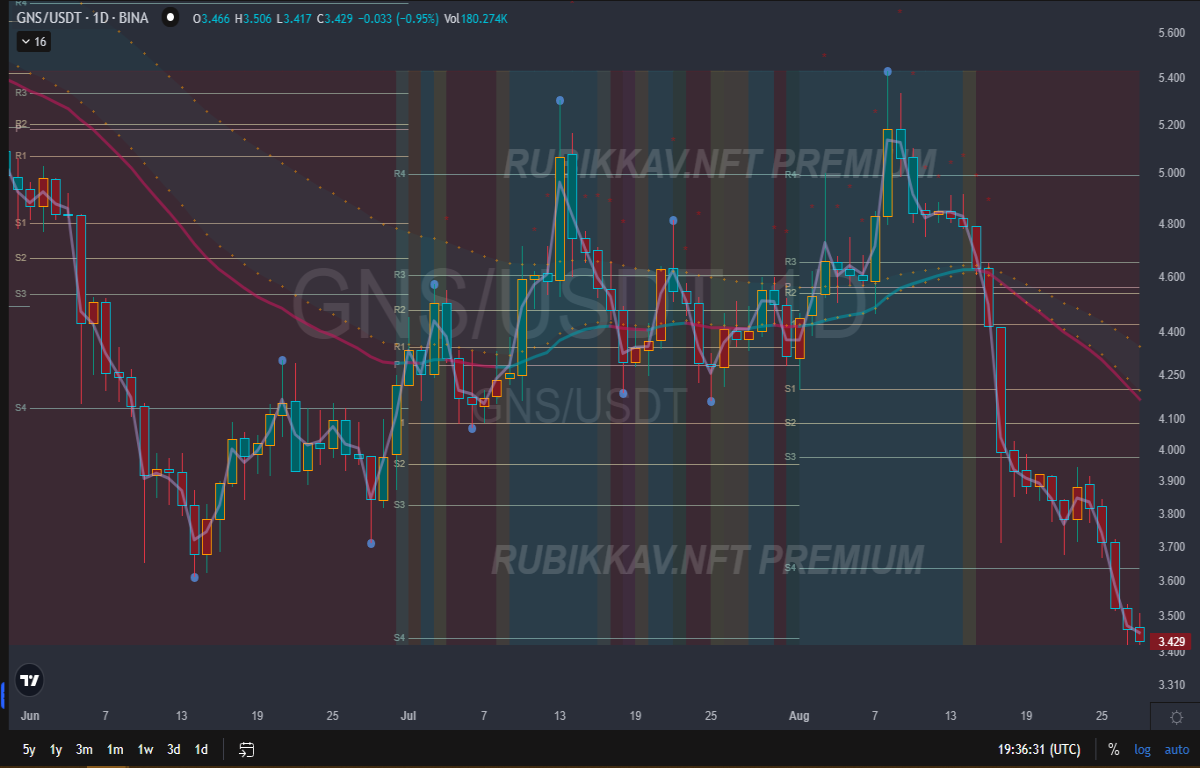
Anticipation for Friday's tokenomics update might help the price climb into this level, then sell off as traders sell the news.
If bulls can punch through this resistance, it suggests some weakness from the bears. A longer-term consolidation may begin, with the price likely struggling in a broad zone from $3.9317 to $4.1964.
This zone is a broad weekly gap formed during the week of August 14th and also in the lower part of July's monthly distribution. It holds the 18 and 40 EMAs. Bulls could aim for bears' stops above August 23rd's daily swing high.
If the price drops and breaks possible support near $3.1000, it might run for approximately $2.7148 to $2.5676. This zone is between the 150% extension of July 13th to 25th's downward move and the 50% extension of the trading range formed between June 14th and August 8th.
Last article does not contain investment advice or recommendations. Every investment and trading move involves risk, and readers should conduct their own research when making a decision.

This article is for general information purposes and is not intended to be and should not be taken as legal or investment advice. The views, thoughts, and opinions expressed here are the author’s alone and do not necessarily reflect or represent the views and opinions of Rubikkav.
Follow more market news and analysis on our main social networks: Wubits, Twitter, Facebook and Telegram.

In case you want to carry out crypto donations, you can do it in rubikkav.nft and rubikkav.cb.id wallet respectively. Your contribution helps further expand this project and reach more people who need a reliable and legitimate source of information.

Trade Binance Futures and Bybit automatically using artificial intelligence with the Cornix Bot. Win 15 days trial now here 👉🏼 https://t.me/cornix_trading_bot?start=ref-195e1582c11e4b7c99b3a35ff4fd4703.

If you have an article that can enrich our community or an advertising piece for a cryptocurrency-based project or product, please write to this email [email protected] or contact support directly on Telegram.

See our premium services at Registrations For New Premium Members Are Officially Open.


