TheGraph (GRT) is a coin hot on my watchlist this week.
Since its project launch and token airdrop in December last year, it’s rallied over 11,000% and made an all-time high on February 12 at $2.88. However, for the past month, it has been moving sideways and seen a correction of 120%.
Because of this choppy price action, it’s a coin that’s flown under many people’s radars while others have outperformed. However, the chart again looks like it’s ready to make its next big move.
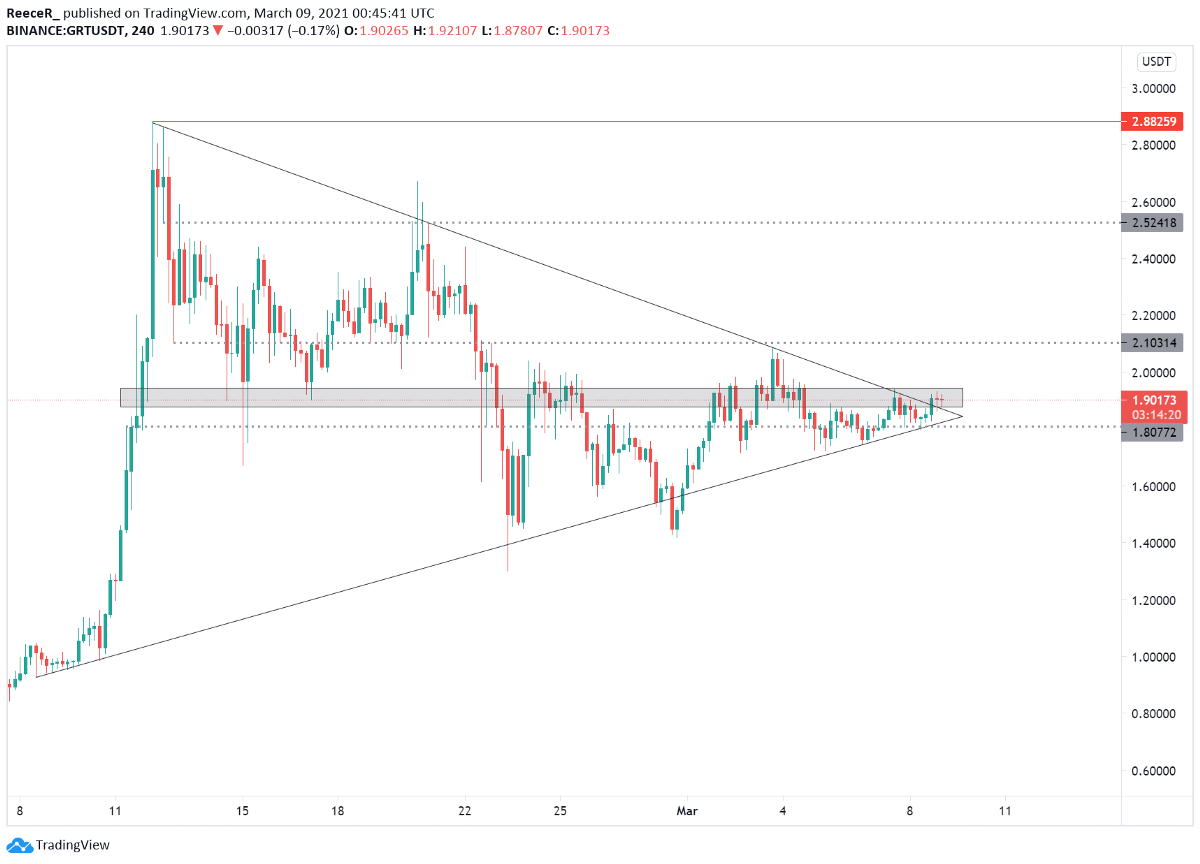
GRT/USDT 4hr chart. Source: TradingView
As you can see on the 4hr chart, the price just recently had its first 4hr close above the downward trendline, which has now been retested and is currently acting as support.
This could very easily turn into a textbook symmetrical triangle breakout if we rally beyond $1.94 and flip the gray box. If this is valid, I’d look for a continuation towards $3 and further price discovery.
Invalidation would come if we see the price drop through the symmetrical triangle and close below the support at $1.80.