
Trading and good TA are a skill. It can be learned with enough effort and people, I think at least, find their niche. One thing I have learned is the shorter your timescale for trading, the better you need to be. I have a lot of respect for people than can consistently make profit in a volatile crypto market. It's not a skill I have yet mastered. People want to find the easy wins and the fast cash, don't look to me for that. I am not here to provide my financial advice or trading calls or anything of the sort. Short term trading, intra-day trading, scalping, these are all things that I leave to those with a far more honed set of skills than I. I will occasionally look for mid term trends, how things have done, or appear to be doing in the coming weeks or months. But even this can be very tricky. For every chart there are 10 different traders that will see 10 different patterns. Bulls always see the upside, bears are always certain the next move is down. But we aren't here to discuss the next move, or even the next next move. I am looking in the longer term. What's BTCs multi year pattern.
I have noticed a big misconception about "the halving" as of late. It seems so many people were waiting for a 5x pump the day after the halving. That obviously didn't happen and the long term patterns predicted that not to happen. Miners have a cache of BTC and a price they want to make when they sell. They are not, in my opinion, waiting for daily sales to pay the bills. The big operations who are mining the most BTC will wait for their price, which means days, weeks, maybe even months after the halving they are still setting their price based potentially in part on BTC mined prior to the halving. Also, they new it was coming, it wasn't a surprise. They have probably planned a strategy around the timing far ahead of time. Also, mining difficulty adjusts only every couple weeks, not instantly or even daily. I say all this help illustrate that the impact of the halving must be considered in weeks, month, even years. You have to zoom out.
So what do you see when you zoom out? Well, it's a pretty predictable pattern. It's fairly cyclical and it does relate to the halving. But the real fireworks don't happen at the halving, in reality they don't seem to come for another year. The halving is, if anything, only the opening up of the runway. Making space for the price action that's to come. But there is another thing about this pattern, it is getting ever-so-less aggressive each cycle. As a percentage of prior peaks and valleys, they slowly get smaller and smoother. Now don't get me wrong, nothing about crypto trading is very smooth, but you can see the asset class as it's maturing. You can see they cycles get just a little less peaky each time. When you zoom out on the log scale you don't see a line so much as a curve. That curve helps define the upper and lower bounds of the projected trading and you can see the long purposeful sweep from top, down to the bottom and back up. Remember this cycle takes years. Here is a chart I put together to illustrate the concept.
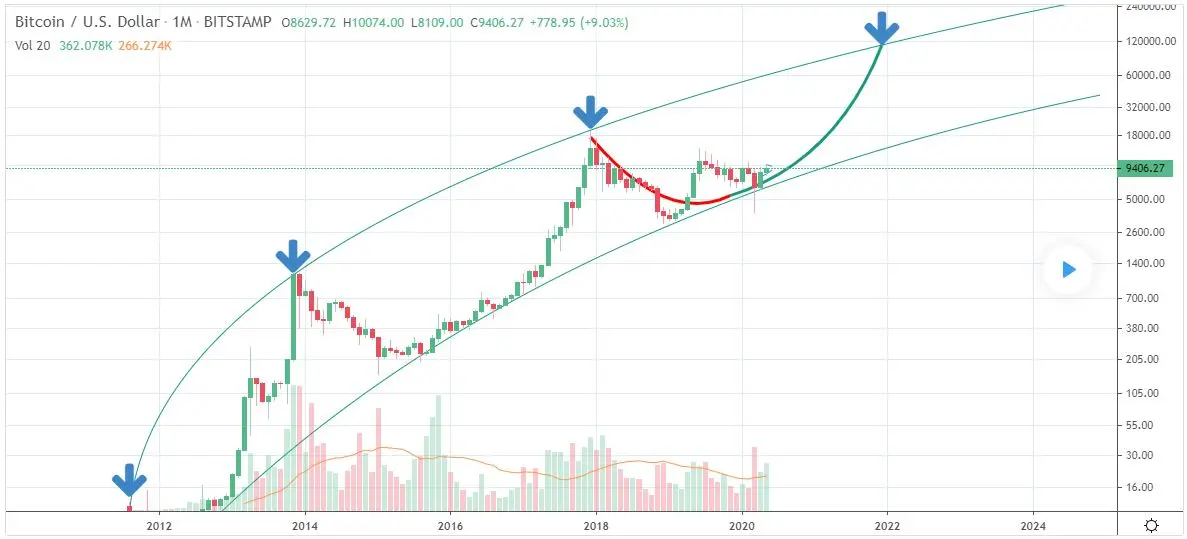
I had initially put the chart together last September and when I checked back to it I was surprised to see how close it was to playing out. If you want to check out that older chart it's right here. At that time my chart wasn't looking as good, and I will admit I very recently made some minor adjustments, but I was pleasantly surprised to see how nicely it was playing out with only the most minor of tweaks. The dump down to low 3k region was a surprise thanks to the Bitcoin Cash wars....thanks Rog, thanks Craig. Also the aggressive recovery up to 14k caught a lot of people off guard too. But as a whole it feels like the price is respecting this curve on the log chart. The price ranges with a long sweeping curve that is ever so slightly flattening over time.
So what does this mean for real price and when? Well that's anyone's guess and don't buy or sell on my world. But, if the pattern holds, and if the price action respects this trend, we should see the peak late in 2021. Also, it won't be there long. Past peaks have showed that those big numbers last for a matter of days. Once the parabolic trend up shows weakness people start taking profits. I suspect a saavy long term trader would be accumulating for the next several months as we ride the support part of the log curve. Once we really start to rise next year you make a few plays on alts if you are brave, or you just ride the wave. Once the 3rd or 4th quarter roles around, I am betting they are going to have their exchange all picked, their targets set and be ready to take some profits. If you can find an exchange with a trailing stop...it might not be a bad thing. Or at least a stop-limit you can crank up as the days go buy.
But what goes up, must come down, at least for a while. So there is a good chance that 2023-2024 will be a replay in many ways. It very well might be a multi-year bear market. Maybe it's a good time to look at stable coins and DeFi savings options or something else. I would expect that the retrace could be significant from the peak, possibly as much as 80% by late 2023. So where do I think it goes? My only guess can be if the price action respects this chart it could go anywhere between $75-100k. I have a really hard time believing the bears are going to let it get over that mental hurdle of $100k. If it does get up near that mark, then the retrace may come down around 20k-ish? But let's not focus on the bear market now. Let's just look forward to next year. I think most people are already looking forward to 2021 for one reason or another. Happy trading!
Please remember, I am just a random guy on the internet, I am not a financial adviser. I hope you find my posts informative, helpful, or amusing. Whatever the case thanks for your time.
Please comment with your thoughts.
You can follow me on the following platforms:
Publish0x: https://www.publish0x.com/recourier
Twitter: https://twitter.com/recourier
Blogger: https://www.recouriercrypto.com/






