
Originally published on the RAFA X account: https://x.com/RAFA_AI/status/2029957764328370203
Note: This trading diary reflects market conditions from March 6, 2026 when the original analysis was published on the RAFA X account.
The Highest Conviction Trades in Commodities Today
I have turned a decent chunk of stables into nothing by piling into a microcap because the chart looked ready to take off. It didn’t. I have shorted on news that was already priced in and watched price soar as the market decided the news was not so bad after all.
Markets have humbled me plenty of times. I am trying to change that one step at a time.
With Rafa now live, I asked a simple question this morning:
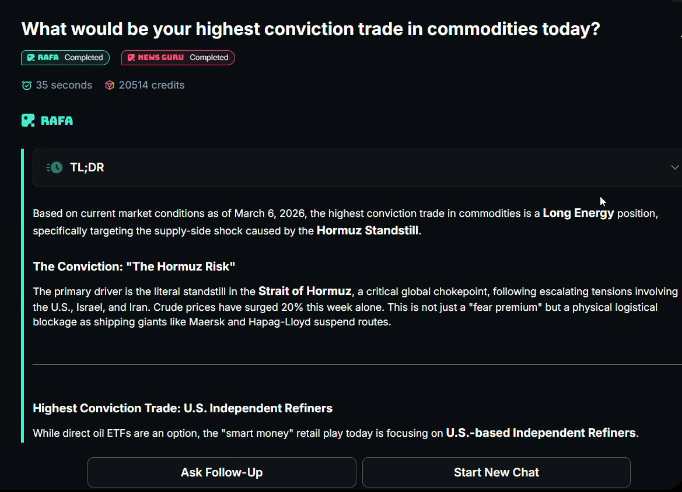
“What is the highest conviction trade in commodities right now?”
The answer skipped the obvious oil ETFs that everyone piles into and instead highlighted U.S. independent refiners such as Marathon Petroleum (MPC) and Valero (VLO). Refining margins can stay strong even when crude becomes volatile.
Oil has been testing that area recently, especially with Middle East headlines pushing volatility higher. Like many traders, when I saw price comfortably above the suggested entry level I was ready to jump in.
Then the focus turned to WTI crude oil itself.
A sustained hold above $81.35 could become the bullish signal worth watching in the current WTI trading setup.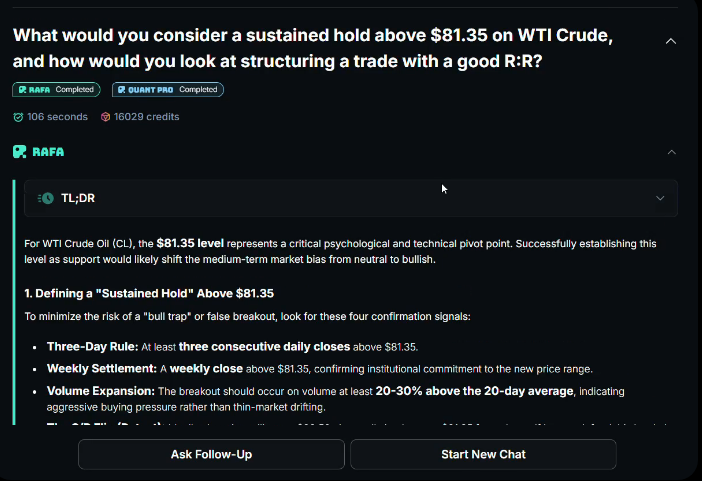
Instead, the advice was simple: “Not yet. Most traders get caught in fake moves here.”
The Breakout Checklist
The difference between a real breakout and a classic trap often comes down to confirmation. Three checks help separate the signal from the noise.
Three Day Rule
At least three consecutive daily closes above $81.35, ideally with a weekly close above that level. This shows that larger funds are actually committing to the move.
Volume Expansion
Volume should increase 20–30 percent above the 20 day average. Slow drifts on low activity days often reverse once real participation returns.
Support / Resistance Flip
Price rallies toward $82.50, then pulls back to test $81.35 from above. If buyers defend the level strongly, previous resistance becomes new support. That is when the setup gains credibility.
Example Trade Structure
If those signals align, the trade structure becomes straightforward.
- Entry zone: $81.45 – $81.75
- Stop loss: $79.80 below the recent swing low and 20 day moving average
- Target 1: $84.50
- Target 2: $86.00
That gives a risk to reward of roughly 1:1.85 to the first target, improving if the second target is reached.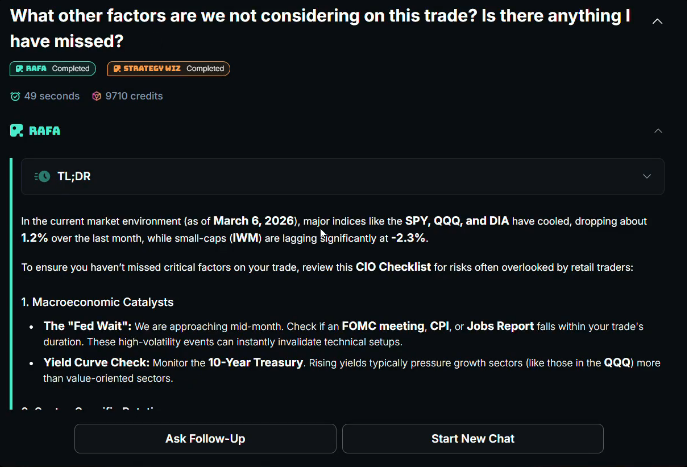
What Could Invalidate the Trade
No trade exists in isolation.
Possible risks include:
-
broader macro pressure on commodities
-
equity market correlations dragging oil lower
-
lack of a clear catalyst such as geopolitical tension or supply disruption
Without a catalyst, forcing the trade does not make sense. It is better to pass and wait for a clearer opportunity.
Lessons From the Setup
There are a few lessons that are starting to sink in.
- Patience matters.
Waiting for confirmation may feel boring, but chasing every move is expensive. - Structure beats hope.
Stops belong at logical levels. Targets should align with real resistance or psychological price levels. - Confirmation beats optimism.
Waiting for retests, volume expansion, and multi day closes may seem uneventful, but it prevents many unnecessary losses.
The phrase I have heard for years is finally starting to make sense:
“Let the trade come to you.”
Until oil proves it can hold above $81.35 with strong participation, this is not yet the high conviction trade I was looking for.
In the meantime, there are always other setups to study and markets to analyze.
If you want to explore the tools mentioned in this diary entry you can learn more here: https://www.rafa.ai/signup
Follow the RAFA community
Discord: https://discord.gg/GWpstsKEQy
LinkedIn: https://www.linkedin.com/company/rafafinanceai/