
So I want to be doing this everyday. Doing this post where I write a detailed analysis of price movement for 3 cryptocurrencies: BTC, BAT and ETH.
Here are the price analyses for today
BTC
Dem bulls come a chargin'.
Bitcoin closed the day pretty bullish, with an all day high of 9820. The price faced an all day low of 9713(data feed from Binance).
Here is the chart:

Looking closely at the final few candles, we can see a double top form and range close to the Bollinger bands top, bottom and middle EMA.
This is a very bullish setup, and although we won't see 10k anytime this week, the volume is there to continue the right range between the high resistance and low support. I really love this setup, and I have made quite some money off of it today.
That said, the current setup has equally formed a rising wedge pattern on the 5 minute chart. This isn't really a prediction of future prices as the chart time frame is too short to make any sense, but that rising wedge is usually a bearish reversal signal or continuation signal. Traders on the 5 minute chart should take note.
BAT
The devil is hidden in the details.
First off, let's start with the chart.

Price has tested the stronger support about 3 times today, and even broke below the support, and bottom Bollinger band today.btjis could be a sign that the support is about to be bounced off, or that the price is about to break to the downside.
This is on the longer term though. On the short term 30 minute chart, it seems like the price is stick in a bearish flag pattern. Since the two time frames more or less confirm each other, we could see a drop back to $0.25.
The bullish bias however will see BAT pushing thorough to 0.27 USD. This will be great for short sellers, as well as option traders as well.
ETH
Up, up and away!
This is probably where the most money is made.
After the Muir Glacier hard fork, ETH price was down in the dumps. And it only got worse as time went on.
But since yesterday, ETH has been stuck in a bullish flag pattern and doesn't seem to stop, as it bounces off the bottom support channel line consistently and bounces back up to the top channel.
Here is the chart:
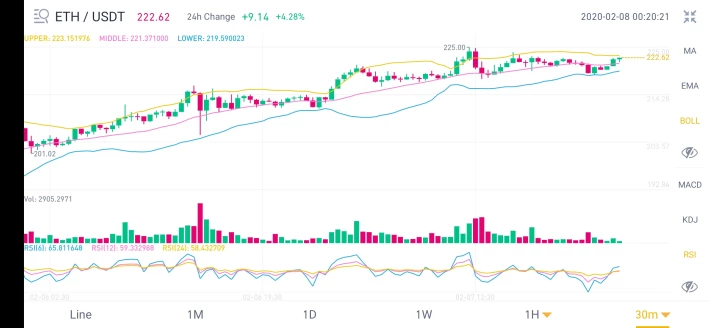
Personally, I don't like to call price predictions, because I'm mostly wrong, and when I'm right, I'm usually very right. But I'm mostly wrong though.
A breakout might occur tomorrow to the next resistance point, given that my 5EMA has crossed over my 15 EMA from the bullish bias.
Let's see what tomorrow brings.
Thanks for reading!






