
Greetings traders of the volatile markets. The current global situation has led to a rise in price volatility among many legacy commodities like gold and silver, making the market more dangerous than usual to attempt day trading. However, with great risk comes great opportunity, so traders actually love volatility like a surfer loves stormy weather due to the big waves it produces for him to ride. So if you’re into extreme sports or high risk living, then these current economic times may be ideal for you to make some life-changing profits as a swing trader, day trader or scalper, what to speak of your long term investor strategy also available to the more conservative types.
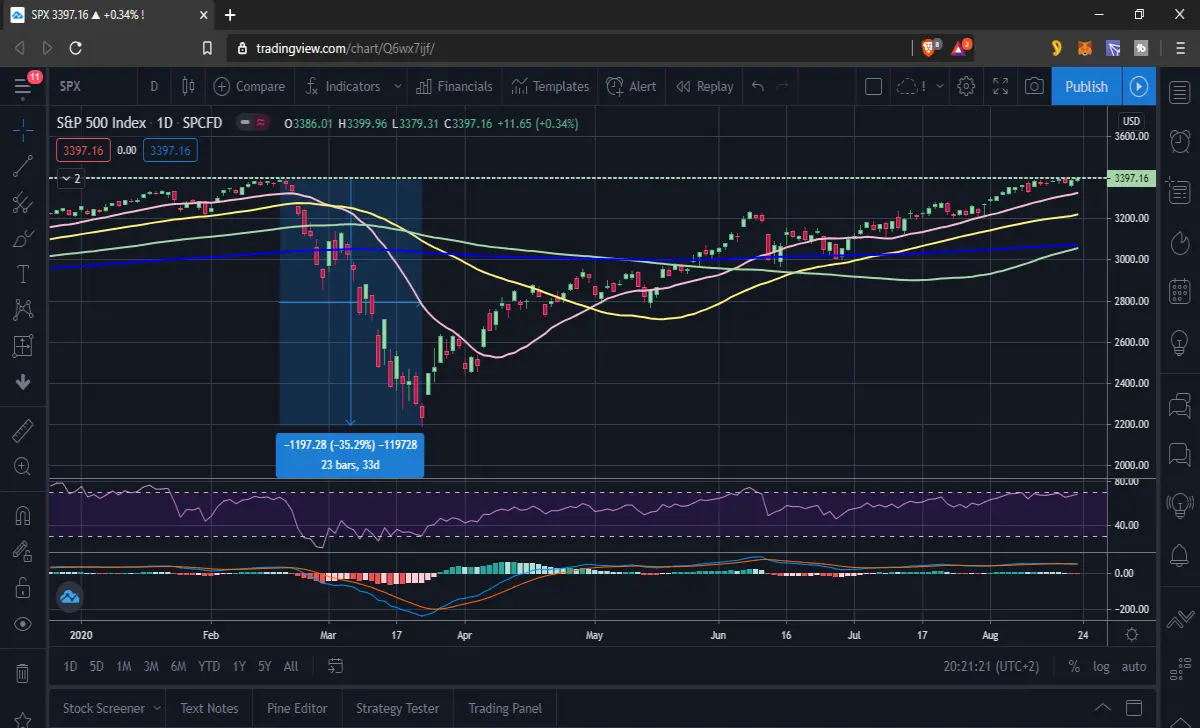
In my previous technical analysis posts, I have looked at my favorite markets, namely cryptocurrencies, and I have also recently discussed gold, due to its recent historic price drop earlier this month. However, in this post I will discuss the S&P500 price chart because it has just returned to and broken into all time high territory and so is worthy of a technical analysis of its own.
Those of you new to trading should definitely use a site called tradingview.com where you can find charts on any and all stocks, commodities, forex and cryptocurrency assets in real time as they are traded from minute to minute. On the very top of the home page you will see a list of the major indices and commodities traded, like gold, oil, EUR/USD and Bitcoin. And it is there that you will also find the most important or significant indicators called the Nasdaq 100 and the S&P 500. These should be studied by any aspiring trader in order to get to know the markets.
Now the S&P 500 is a valuable indicator of the overall stock market because it is comprised of the 500 largest US publicly traded companies, and so is regarded by traders as the best overall gauge of the overall stock market today. It is measured by market capitalization, so that the company with the most shares publicly available in dollar value terms, will be at number one. Generally it is led by the tech stocks, as well as financial corporations and pharmaceuticals industries. You can actually trade the value of the S&P 500 in and of itself, as an indicator, regardless of the stocks in it.
Remember that the way in which companies are listed here is by calculating the current stock price of a company and multiplying it by the amount of shares available to the public to trade. Thus the S&P 500 is a prime indicator of the overall health of the US economy as a whole, since it is the sum of its top traded stocks. At leas that is what the initial logic implies. However, as we can see after this year’s historic global events, the S&P 500 index is not quite as accurate a measure of economic health as we would like to believe.
We can take a look at the S&P 500 chart and we will see that it has been climbing for the past several years, with occasional retracements of course. By mid 2019 the S&P 500 had reached a peak at around 3000 points, and then by 19 February 2020 it hit a new all time high of 3393. In the following moth however, the global covid pandemic arrived and the entire financial world went into a tumble. Thus the S&P 500 index crashed all the way down to 2200 in just 30 days. This historic 35% drop took us back to 2016 levels. It also indicated that the 500 topmost companies in the US had all collapsed in stock price due to the pandemic and lockdown.
However, in the five months after that fateful collapse, the index has returned to exactly the same all time high. So as I write this now in late August 2020, five months since the collapse began, price is again knocking at the door of 3397, surpassing the previous high of March by four points at market close. On initial observation this appears to be a full recovery. It looks like the US stock market simply rebounded and returned to its old pre-covid levels, as if life was all back to normal, at least financially. But this apparent indicator of overall health is very misleading.
Although the overall value of the S&P 500 top stocks has returned to normal, totally wiping out any loses. the reality inside is that only 19% of stocks actually listed there have made gains during this lockdown. The vast majority – 62% have suffered significant losses and have not regained their value at all. Thus the S&P 500, and in fact numerous other indices, have all lost track with normality, so to speak. They no longer reflect financial normality. And that may be because global finance is no longer in any way normal, but that is another topic for another post.
What we can see if we look more closely at the S&P 500 stocks, is that some sectors made more gains than others. For example more than 50% of stocks in consumer staples, health care and IT all showed gains since the crash of March 2020. But less than 10% of stocks in the energy and utilities sectors regained prior value. In other words, this apparent return to the all time high for the S&P 500 is illusory in a sense.
Because it is so heavily led by tech and IT and big Pharma, America’s stock market appears to be healthy again, but the reality is that only 32% of the top 500 stocks and companies are in the green. That means that two thirds of America’s top companies are still under the influence of the man made economic collapse. This is not a political article, but I just wanted to pint out the economic reality as it stands.
Nevertheless, the S&P 500 is weighted or biased towards those top few massive corporations, known as the FAANG stocks, namely Facebook, Apple, Amazon, Netflix and Google. The top ten biggest companies would start with Apple at the top with a market cap of $1731 billion and an index weight of 6.4% of the S&P 500, followed by Microsoft, Amazon, Facebook, Alphabet (Google), Johnson and Johnson (pharmaceuticals), Berkshire Hathaway (Warren Buffet), Proctor & Gamble and finally Visa.
All of these top ten corporations can be traded on the stock market individually but they are also the leaders of the 500 listed in the index known as the S&P 500, which can, in itself, also be traded by traders like ourselves. And so to do any sort of technical analysis of the S&P 500 right now is extremely difficult. It may have returned to ATHs (all time highs) but this may well be based on massive money printing by the Fed to bail out the nations economy which crashed under lockdown.
This entire bounce back to apparent economic normality could just be another bubble waiting for the next leg down. With so few stocks actually regaining value, and with so few really big names appearing to make new highs, like the FAANG stocks, the reality is that the majority are still in a slump of note and so the economy is still damaged. There may well be a second roll over and downtrend to come. There is a noticeable bearish divergence on the daily RSI since 8 June. Price is making higher highs but the RSI is making lower highs, which is a classic bearish divergence pattern. The same is true for the MACD.
To conclude, I would suggest that all aspiring traders learn about the S&P 500 and other stock market indicators, as they can be traded and they can also shed light on the overall health of the world’s largest economy. However, I would be very careful right now about trying to predict a long or short trade on the S&P 500 at this time. Wait for confirmation of a trend before jumping in to a trade, and keep a stop loss in place. All markets are quite volatile right now, and although this is a prime time for traders to scalp some profits on that volatility, the waves could be large and could be real dumpers.






