
Yesterday 5 November saw bitcoin make a massive gain of $1500 as the bullish green daily candle smashed through its rising trend line to defy gravity once more. It certainly appears like bitcoin is off to the moon regardless of anything going on back on earth. This upward move in price was over 10% in gain, making it the biggest price spike since 27 July, over three months ago.
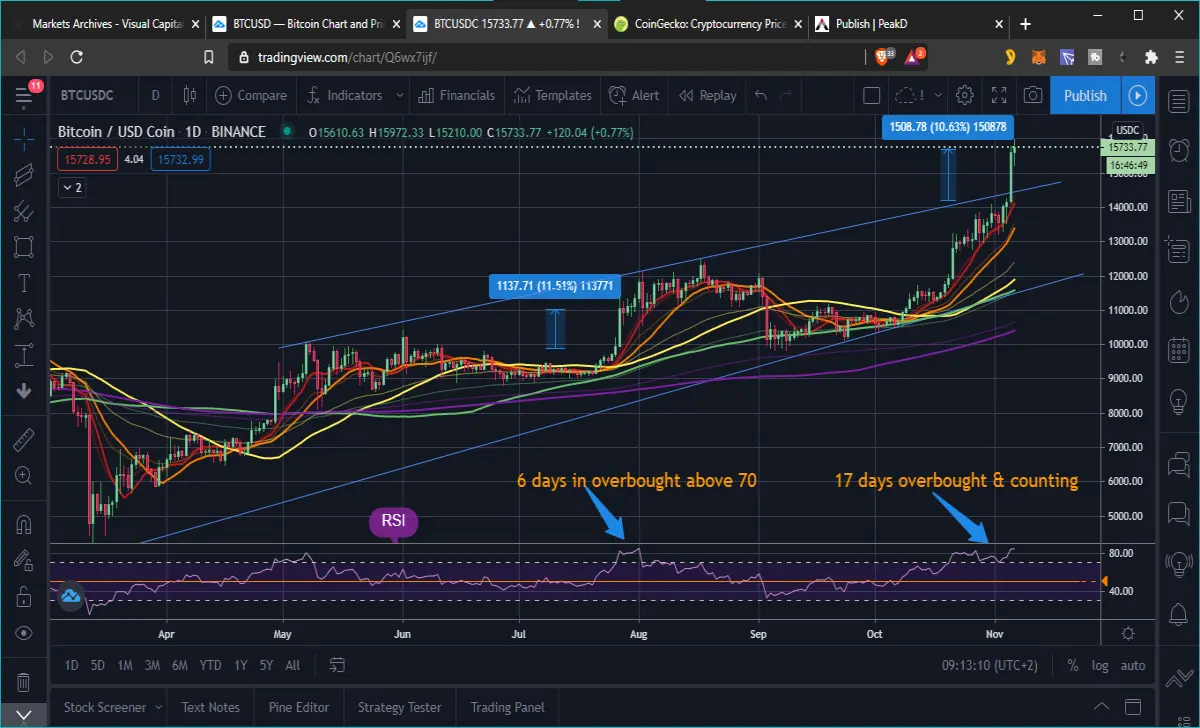
Curiously the previous price spike in late July was only $1100 in value, but proportionally it was bigger that yesterday’s spike simply because it was at a lower price range, and so in percentages it was over 11% gain. Nevertheless, these ongoing massive price pumps overnight are clearly showing bitcoin’s bullish capacity and long tern trend right now.
For the past 30 days now bitcoin has found support at the 10 day Moving Average line, shown in red on the graph, and is way above the longer daily MAs, shown in the other colors. As a result we can expect a natural retracement in price back down to the 10 day MA, which is currently just above $14k, if nothing else. Since this may take a few days to play out, a best case scenario is that price will retrace to test the upper trend line shown in blue on the graph, which may be above $14k by the time price dips.
We have been waiting for the dip for weeks but bitcoin only wants to keep climbing at present. It only has eyes for the moon, it seems. The RSI, shown in the purple strip along the bottom of the chart page, has been way overbought, above the 70 range, for the past two weeks. And yet price simply continues upward. A retrace is inevitable and the opportunity to buy the dip will come, so be ready to buy when it does.
Anywhere on the purple RSI band above the 50 mark, shown by the orange line across the middle, indicates bullish momentum, and so as long as the RSI is above 50, we are still potentially on a bullish uptrend. If bitcoin continues in this mood, we may see the daily RSI dip to 50 at some point, but then find support there and bounce back up, as a best case scenario.
Nothing is certain of course, but that is a good indicator to buy in, when the RSI moves up above the 50 mark. Below 50 means that bitcoin price is still under bearish pressure. Therefore entering a buy or trade above the 50 or middle range of the RSI is a safe strategy in this particular long term bullish market this year and next.. As we can see from the RSI, in September it remained below the mid 50 level and similarly price hardly climbed, but once the RSI pushed above the 50 level, on 7 October, a month ago, it pumped massively.
The same thing happened in July at the last massive green daily candle. Price trended along horizontally, in a range-bound channel until the RSI pushed up past the mid 50 level for most of July, but then pumped massively when the RSI crossed over 50. This time around the RSI is remaining above 50 for a lot longer, and indeed also above 70, or oversold, for way longer than usual. In July the RSI remained oversold for 5 days, this time around it has been in oversold territory for the past two weeks, or over three times as long.
This indicates that overall bullish momentum is vastly increasing as time goes on in the current bullish phase of bitcoin’s long term cycle. As a worst case scenario, just to be aware of it, price has, in the past sometimes retraced to the 100 day MA, shown by the green line in the graph. This line currently coincides with the bottom of the blue trend channel. So it would not be out of character to price to actually dip that low, especially after such a bullish spike.
That implies that price could fall to around the previous highs at $12k, give or take a $500 range. But I don’t foresee price falling lower than that in this current bullish phase of bitcoin’s long term trend. This is just my opinion as I am not an expert and can only speculate based on past price action, as shown in the graph. This is where technical analysis, or chart reading, can assist us in making our future predictions. It’s all about pattern recognition. All the data is there in the chart, we just have to be able to decipher it for future probabilities.






