
Bitcoin has had a very impressive rebound to the upside over the weekend and is holding steady at previous resistance. With price back over $19k, the downward trend channel has been broken and now acts as support. It looks like price is hitting the glass ceiling of the upper $19k region but being rejected now for the fifth time.
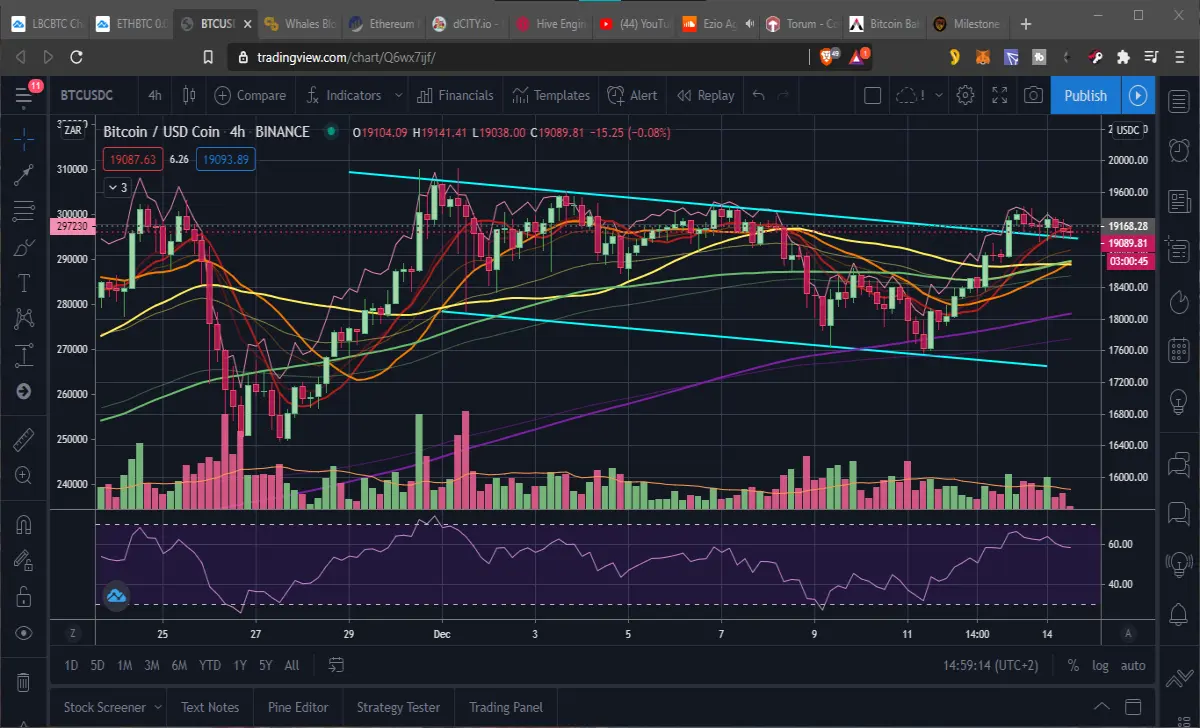
Is this the exhaustion of the bulls in their attempt to break the ATH with significance and volume? Price is exactly where it was in December 2017 at the previous ATH. This time price is hovering at this resistance compared to last time when it dropped much faster in a retrace after the parabolic pump and blow-off top.
Ultimately price is at a crossroads now, a point of consolidation in this sideways trading range. The RSI on the 4 hour has topped out again, although at a lower high to last time in last November. Price has not reached the overbought level, but the RSI has nevertheless begun a retrace.
This was a good short term rally to the upper band of the channel. We will need to wait and see if price falls back into the trend channel, and falls to the lower previous support around $17.7k (current 200 EMA on 4 hour) or lower, in the same descending channel.
Before that there is a massive confluence of moving averages MA’s, with the 20, 50 and 100 all converging right now at $18.7k. If that breaks, then we may see the 200 retested as support, like it has before, around $18k give or take $200 either way, depending on whether the SMA or EMA become support.
On the daily chart, price has closed a candle back above the 10 and 20 MA yesterday. This appears to be a bullish sign, however, price is not climbing any more with the same uptrend as the previous parabolic move. I would say that the daily chart is showing signs of the bulls being exhausted. This is because some whales are taking profits at this point of previous ATH. This is true of both BTC and ETH.
According to https://cryptobriefing.com/whales-block-bitcoin-ethereum-highs/, seven massive whales have sold or distributed their tokens. Also on chain data from Santiment, reveals that “the number of addresses holding 10,000 to 100,000 BTC has significantly dropped in the past month”. So selling pressure is just preventing price from smashing the ATH and $20k with much strength.
So the recent little pump over $29k this weekend was impressive and perhaps a chance to take profits in time for the next dip. On the other hand, the same article linked mentions how there is also a large buy wall and that the bulls are buying it up as fast as the sellers are redistributing it.
“Based on this on-chain metric, more than 2 million addresses had previously purchased over 1.20 million BTC between $18,300 and $19,300.”
Apparently we are still in potential bull territory until a candle closes below the $18.3k support from those buyers there. Personally I am awaiting the retrace, and often trading is about patience, doing nothing and waiting. Then it simply requires a few trades and the the waiting goes on some more.
Thus the strong hands and the sharp eyed trader sees opportunity by timing the market, and doing less as opposed to doing too much.






