
Welcome to another edition of TA the easy way and today we look at the mighty bitcoin as it takes a breather after that massive pump to the latest ATH. Price peaked on 17 December at $23750, the new glass ceiling between us and empty space. Humanity has never been this high before in the bitcoin space rocket. Will we fly still higher under this trend, or is it time for us to dip back for the retrace?
Usually it’s good for price to take a gradual step by step upward move in a gradual channel. However, now that the bull cycle is in swing, price has found massive buying pressure and is using the elevator to go up. This is counter the norm, as bitcoin usually takes the stairs up and then the elevator to the downside thereafter. So in the new norm of the bull cycle, price movement may be outside the norm, and therefore less predictable.
This is an in-between phase or transition phase in the long term journey to the moon. We have maxxed out our upside potential for now and price has been consolidating for over 48 hours. If we look at the 4 hour chart, we can see a descending triangle pattern forming. Normally this would be a bearish pattern but since we are at the ATH, having been bullish up until now, it could be a continuation pattern to the upside. The RSI on the 4 hour chart is also still bullish, bouncing on the 70 range and remaining above it in overbought territory. This could well be consolidation before further upside.
Volume is however declining, which is normal for a weekend. As a result price may simply trade sideways for another 36 hours. The support seems to be at $22.4k which is the current 20 MA on the 4 hour. A break below that is my signal for further downside to the massive support back at the previous ATH of around $19.7k, which is the 100 EMA on the 4 hour chart.
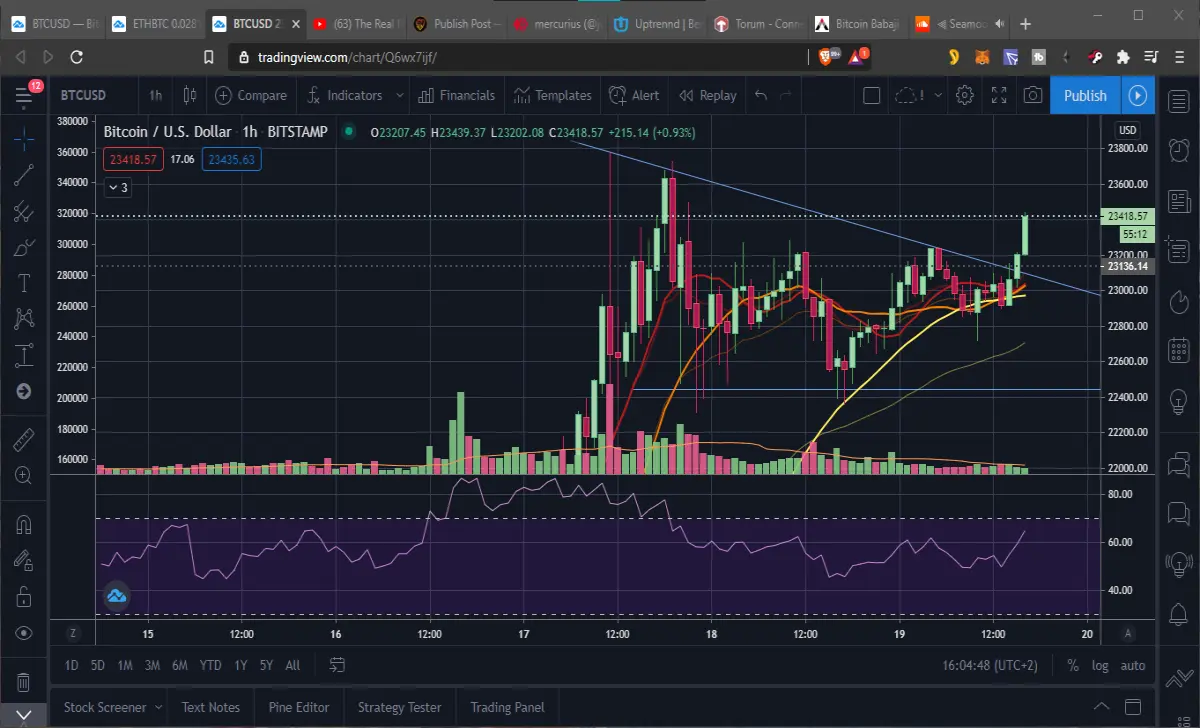
Taking a look at the 1 hour chart, which is not something I do much nowadays, since I’m looking more at longer term swing trades, compared to day trading, we can see that the 10 and 20 MA are converging with the 50 MA at $23k. Let’s see if we have a sudden breakout as these 3 MA levels meet. We are also at the top of the hypothetical descending triangle formation pattern. Price is busy pushing above it right now. If we have a close above it in the next hour, or more specifically above the $23250 recent resistance, then I would expect a further upside pump to test the ATH of $23750.
I know this is a tight range but this comes after the massive pump that we just completed to get here. Even the RSI on the 1 hour chart is remaining bullish and staying above the mid 50 range for now, actually consolidating between the 50-60 range, with higher lows. Again, since it’s weekend and volume is low, I don’t expect much more of a pump. It may be a different story on Monday morning, when Asian markets open, ahead of the rest of the world. The sun rises in the east, after all.
My personal bias would be to the downside now, after all this bullish momentum and with the 4 hour RSI overbought, but in this bull cycle, we can stay overbought for much longer than usual. On the daily chart, we have room to retrace to the 20 MA at the massive earlier support of around $19.7k, so that would be a good initial entry to buy the dip.
Of course, price has been seen to wick below that and close above it, so $17.6k would be the next possible support, lining up with the previous lows there and also with the 50 MA on the daily. This would be a big dip though, as it would mean breaking below the 200 MA on the 4 hour, which hasn’t happened since early October, over two months ago.
So to conclude, as you can see, I am not going to call it either way. Signals are mixed and so I will simply observe for now. A short term secondary push to the upside would be possible, with a later inevitable retrace, perhaps on Monday. But then these are not normal times for bitcoin. They are extraordinary times, where the bulls will reign overall.
PS: As I’m posting this price has broken up out of the triangle as expected, right at the convergence of 3 MA lines on the 1 hour chart.






