
As I write this, bitcoin volatility is going through the roof. Price is sky-rocketing, since smashing through $20k, and now sits above $22k having pumped solidly for almost 20 hours. But now price is hitting a massive retrace back down by 6% in the past hour alone. Is this the blow off top after the parabolic 22% pump in as many hours?
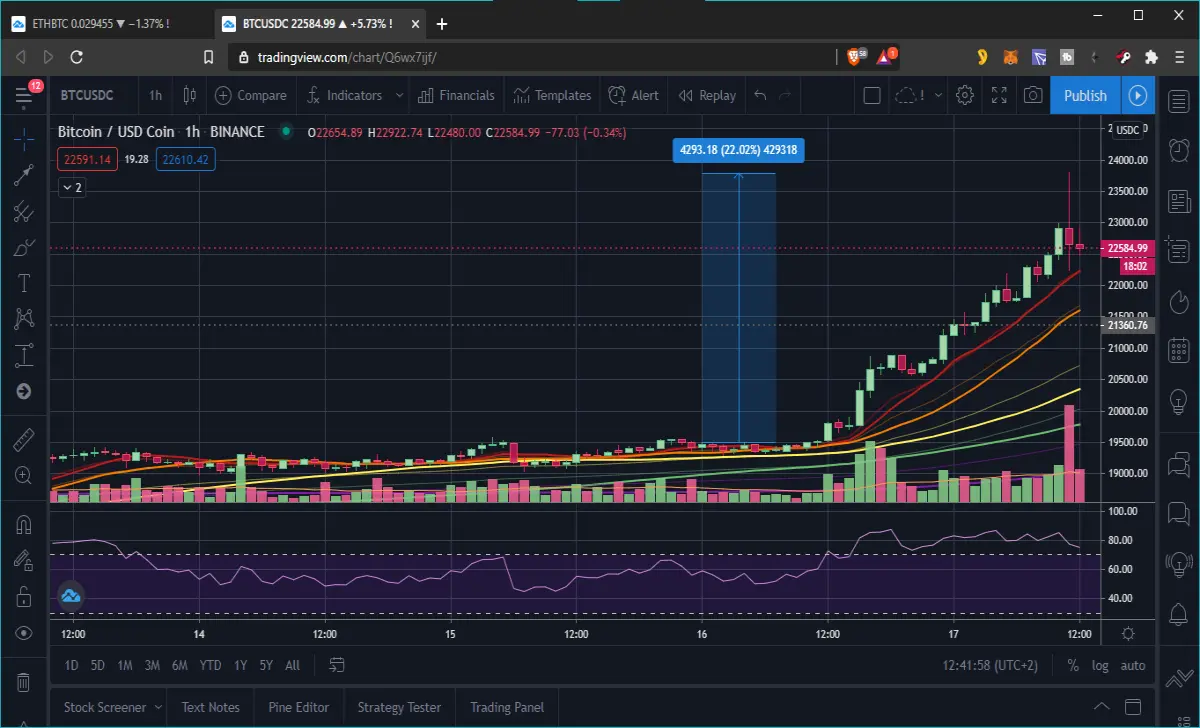
The red bearish candle on the 1 hour chart is bigger than any I have seen in a while, at least since late November, when price also showed massive initial pumping motion. Bitcoin will be fit after all this heavy lifting. Now price on the 1 hour is dumping back to the 10 EMA for support. Let’s see if that level holds and we stabilize at $22k or whether this is the retrace to further downside after such a massive pump.
All this is happening in real time, and is time sensitive material. The volatility after the ATH which brought us the smash through the legendary $20k, is like popcorn time for all crypto enthusiasts. It’s my new form of movie watching. I just watch the charts and price volatility to see what buyers and sellers are doing. It’s better than seeing the hero and the villain fight it out in any movie.
I feel like a media reporter at a live incident. Bitcoin never sleeps of course, and the coming year of bullish momentum will show us new miraculous movement to the upside that will be captivating to my reporter’s eye.
When price smashed through $20k recently, Binance and Coinbase had some issues apparently, which can happen with increased volatility. The system gets flooded or jammed with buyers and sellers and the network takes strain apparently. Even top exchanges go down under the pressure sometimes. Just when you need them. So there are always uncertainties in the crypto market.
We are still in bullish territory right now as the 1 hour RSI remains above 75. Let’s watch and see, where this goes. Is that the moon I see approaching overhead? So far the ATH on the previous hour’s candle is at $23.7k. Yes, it is the moon... of Jupiter. Get your moon boots on and your oxygen tank because the G-forces and the stratospheric rocket launch is set to continue all year long as bitcoin defies gravity and gets pulled to the moons.
Remember also that at this level of price, a $1000 move is not as much as it used to be, in percentage ratio, so we will be seeing $1000 pumps and retracements much more frequently, equating to about a 6% move, for example.
ETH/BTC falls through the floor as bitcoin pumps
I also want to mention the ETH/BTC ratio, because it is also looking dangerous as this bitcoin pump and retrace occurs. After spending weeks bouncing up off the 0.03BTC support level, price has just crashed on the 1 hour chart. As bitcoin pumps, then ETH loses BTC value.
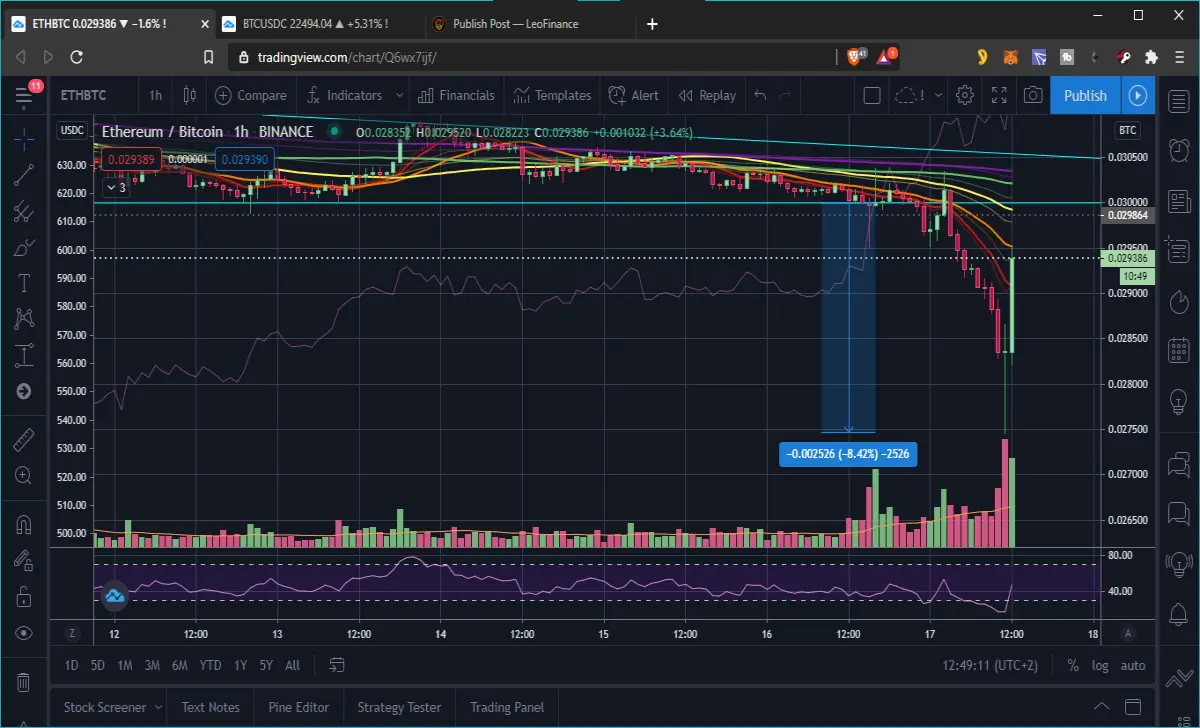
In a matter of the same few hours, ETH could not keep up with BTC, despite making substantial dollar gains in this bullish move for the top coins. However, for a few hours ETH was down 8%, but in the last hour the bulls bought the dip and the crash was just a momentary blip. Now the ETH/BTC value is back up, less than 2% down from the initial 0.03BTC support line. Will that level now act as resistance. It may but if bitcoin settles at a certain level now, it will give ETH a chance to catch up in BTC value.
This is what a real bull market looks like. Massive volatility and extreme pumps and dumps. It’s a good opportunity for savvy or experienced traders to make some massive profits, if you know what you’re doing. We can all learn along the way. After all timing the markets is developed by spending time in the markets, as they say.






