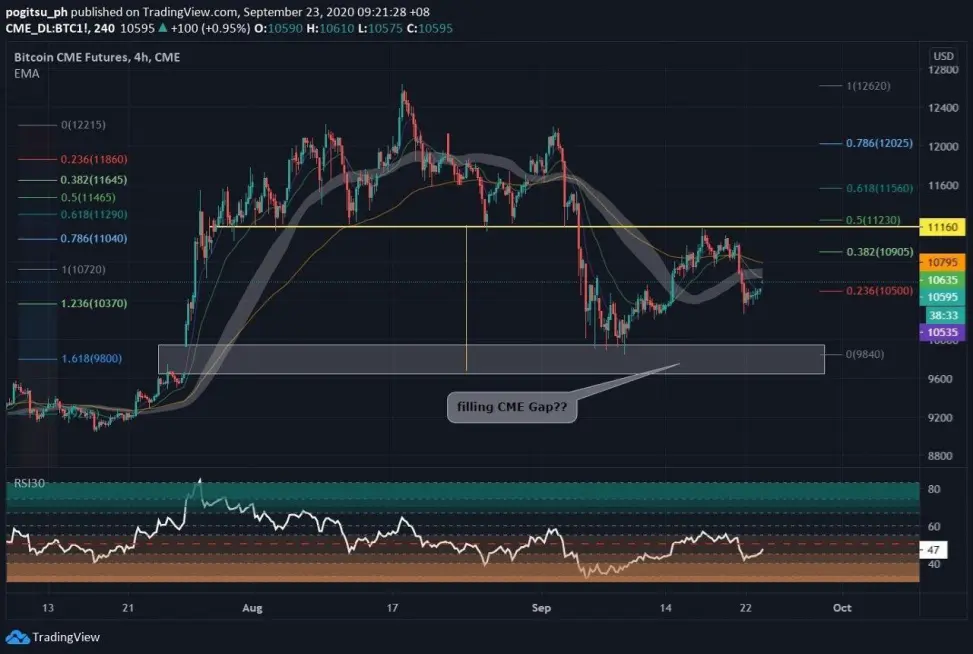
Above chart shows BTC1! or Bitcoin CME Futures
These are pointers with Bitcoin chart related to its price action these past weeks.
- A clear rejection or selling pressure seen at $11,000 to $11,200 area, previous support turned to resistance
- EMA50 (Exponential-Moving-Average with 50-day period) also acts as a resistance looking at Daily Time-Frame. See white shaded area.
- $11K zone too is 0.5 level of Fibonacci Retracement from swing high (~$12,600) to swing low (~$9,800)
Should we see CME Gap filled anytime soon at $9.6k area? Important to note: this area is also a confluence of minimum target of Head and Shoulders pattern break down (yellow vertical line).
In any financial market, nothing is certain. We must react rather than predict what could be the next price movement of bitcoin. Keep tabs!





