
Let's look at LUNC charts with my favourite FIBO MAs analysis.
Starting with 15m:
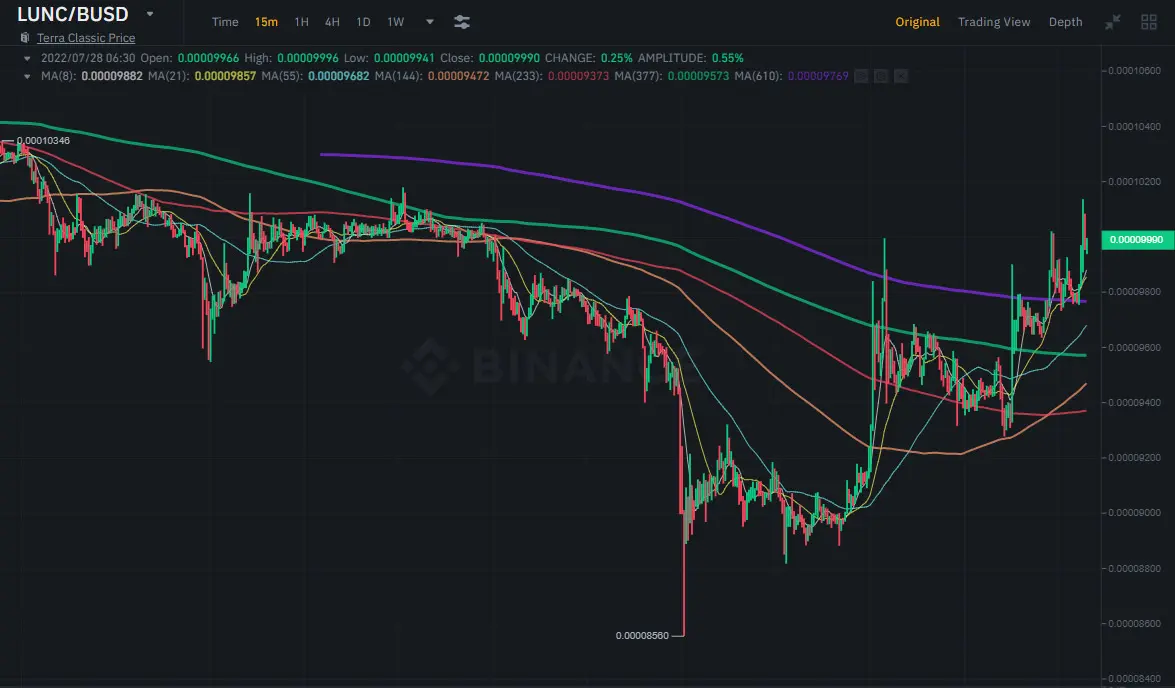
15m chart looks perfect, and shouts that "I am ready to take off" Price crossed all MA lines over.
1H chart:
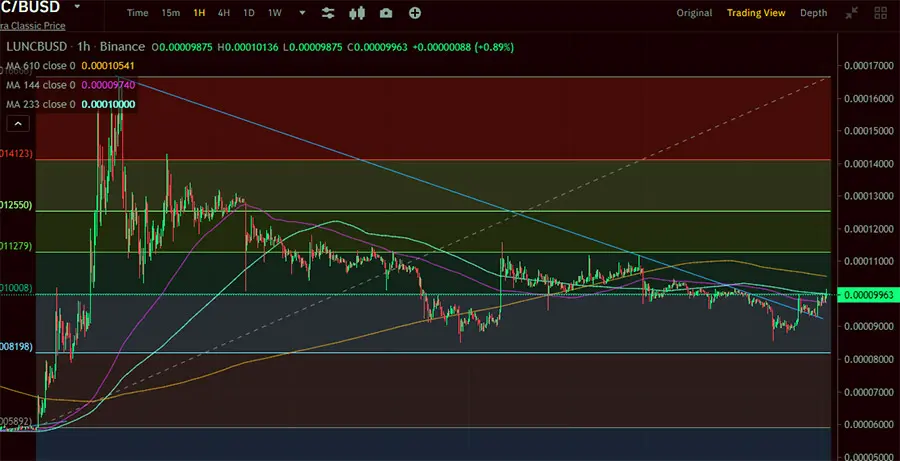
There are two resistances; Fibo 0.618 line (0.00010) and Fibo MA 610 (0.00010541 for now)
4H Chart:
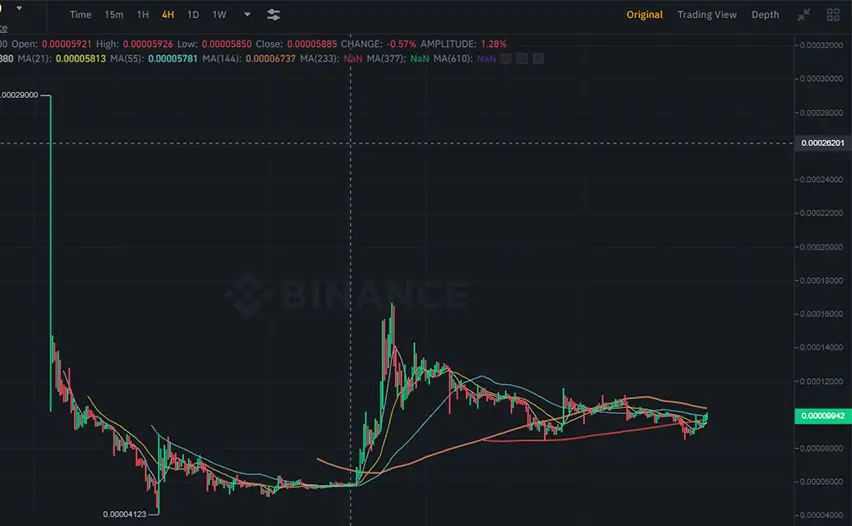
It's above the biggest MA (233) and there would be a resistance on 0.00010430 (which is almost same with above)
1D Chart:
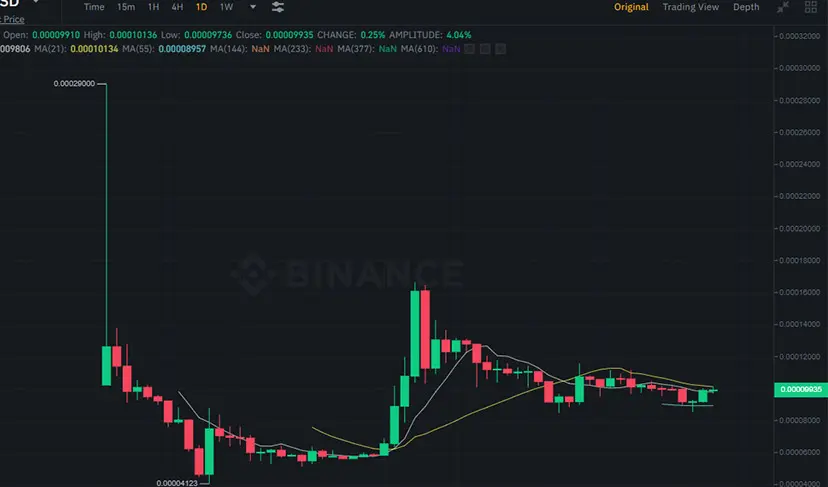
We have only 3 lines in this one. We are above newly formed 55 MA and 21 MA stands on 0.00010134.
So, long word short, if it can cross over 0.00010400 and remain for 2 consecutive bars (for 4H) I think we can witness a new run for LUNC.
Of course this is not a financial advise and don't forget that price of this token is subject to high volatility!






