
We've noticed a manipulative trend in crypto news lately. The market has turned into a stage — for some, a scene of tears — especially for gamblers used to gaining without much effort. Now, power is shifting hands. The gamblers are stepping aside, and analysts are rising. More than ever, study and knowledge are becoming essential to know where you're stepping.
Let’s dive into this exciting journey that began on Friday, July 5th.
Understanding the Solana Market at the Moment of Analysis
It had been a while since I last published an analysis. I’ve been recovering from an illness (tuberculosis), and I stopped trading between December and January. First, I looked into the news — and I was surprised.
I thought, “Wow, so Solana is riding a hype wave today?”
I learned about the Grayscale ETF that includes SOL, saw articles about Solana gaining traction, and even ChatGPT was showing bullish sentiment on SOL.
Then I checked the chart — and what I saw left me speechless. A massive drop from the early 2025 highs. A peak near $300, then a fall to $95 by Apr.
And what we also noticed is that after the drop, there was a correction. But then, another one-month decline followed — a 32% drop.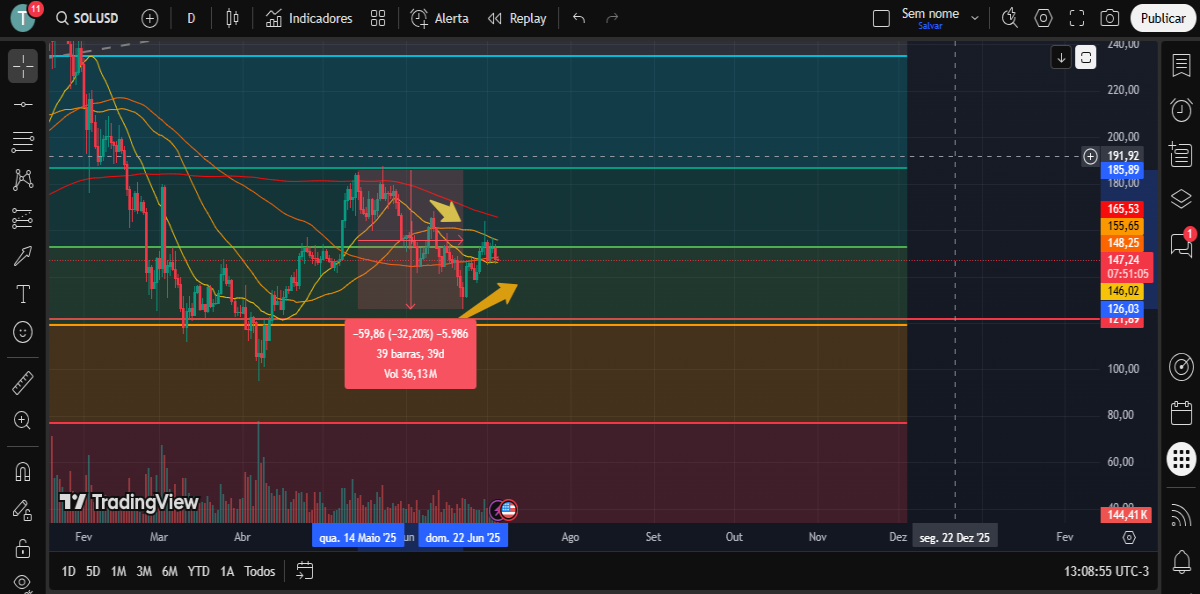
I realized: those who follow the hype often lack real understanding of economics, price formation, or the supply-demand balance (supply and demand curve and equilibrium point). They artificially pumped SOL’s price for a short period — and now it demands a correction that could last for months. And that’s exactly what we’re seeing.
Short-Term Analysis
I ignored medium- to long-term targets at the current price range, waiting for stronger confirmations and, above all, avoiding dangerous zones that I identified in my analysis.
However, with eagle-eyed precision, I spotted a short-term opportunity.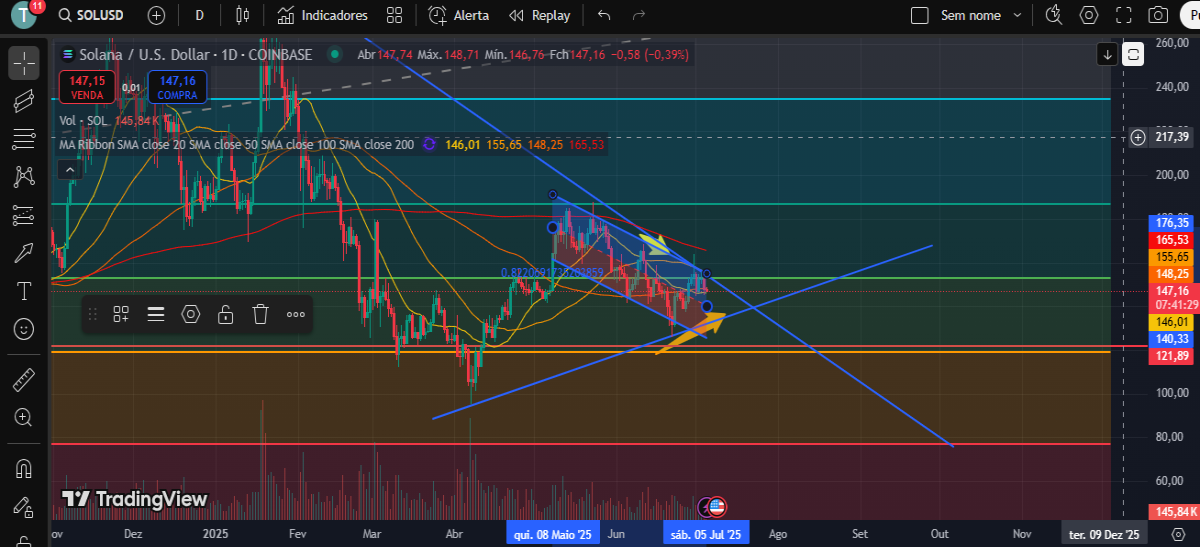
After the previous red candle, I saw that the only viable entry would be at $146 in SMA 20. Not only was there a strong support zone there, but several indicators aligned as well. I set the price targets in a narrow oscillation range — between $5 and $10, with an average of $7.50.
The Result
My focus is on precision — not on FOMO.
I’m not after greed. I’m after accuracy.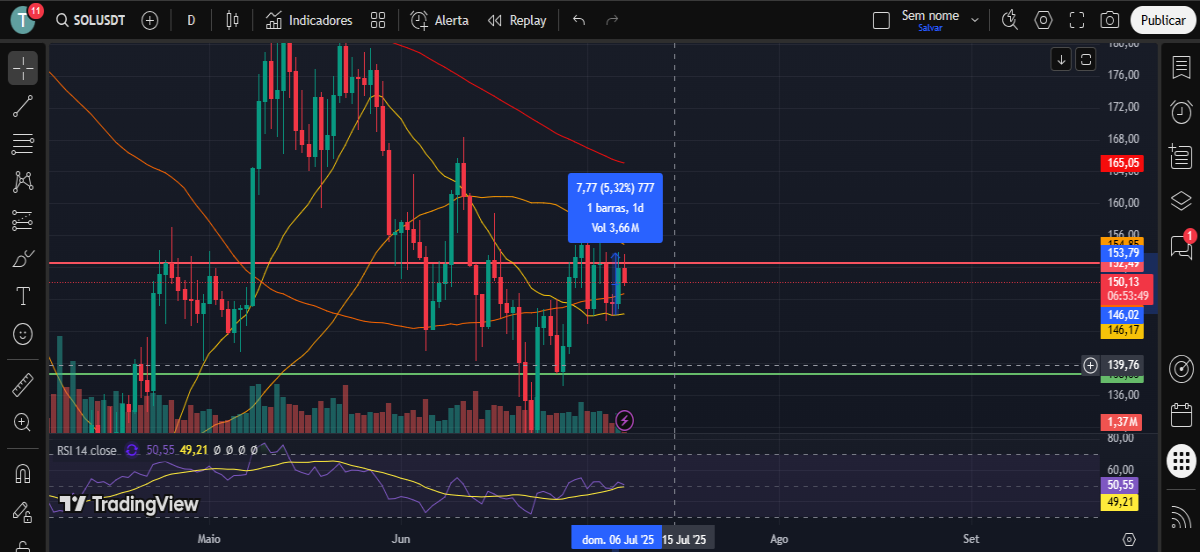
That’s right — on the same day, SOL hit $146.
And the next day? A $7.77 increase.
777 pips, a +5.32% rise.
A perfect number.
And symbolic for me — because I had asked God for a confirmation of this gift He gave me: an eagle's vision.
Be Part of Something Greater
Want full access to the complete analysis behind this result?
Want to go deeper, understand the logic, and not only replicate, but also anticipate the market?
Join our free Telegram group: Nesher Trading Club
https://t.me/+YOvZYZymaW5iMjlh
Receive exclusive analyses, strategic signals, and teachings you won’t find in the crypto mainstream.
Come fly with us. Hunt like an EAGLE.
While some trust luck, others trust signals.
And signals, when correctly interpreted, can change everything.


