
Back to analysis
Hello everyone, back again. I was very busy studying, life of a Business Administration graduate. Let's go to another case, where I will talk and show a good negotiation window that occurred from 04/14 to 04/21 (7 days, what a perfect number, my dear gentlemen).
First, see the trading ticker on binance here, so that there are no doubts.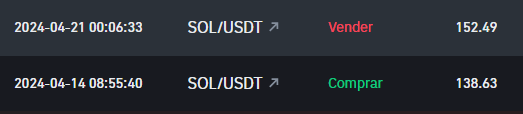
First, for those who wonder why I don't buy and hold. I'm not rich, I need to pay bills while making quick, profitable and assertive moves. Second, when you know the probability of larger declines, it is obviously preferable to look at these signals and only enter the best opportunities, bottoms and confirmations.
Result, seven days and a profit of 9.09%...
Now for the analysis. I use market supply and demand theories to outline my targets and objectives. I am a serious analyst and I have a reputation to maintain, so I do not use old-fashioned techniques, but rather, statistical analysis and the same operators as institutional traders. After all, I'm in the financial administration field. Let's go to the graph.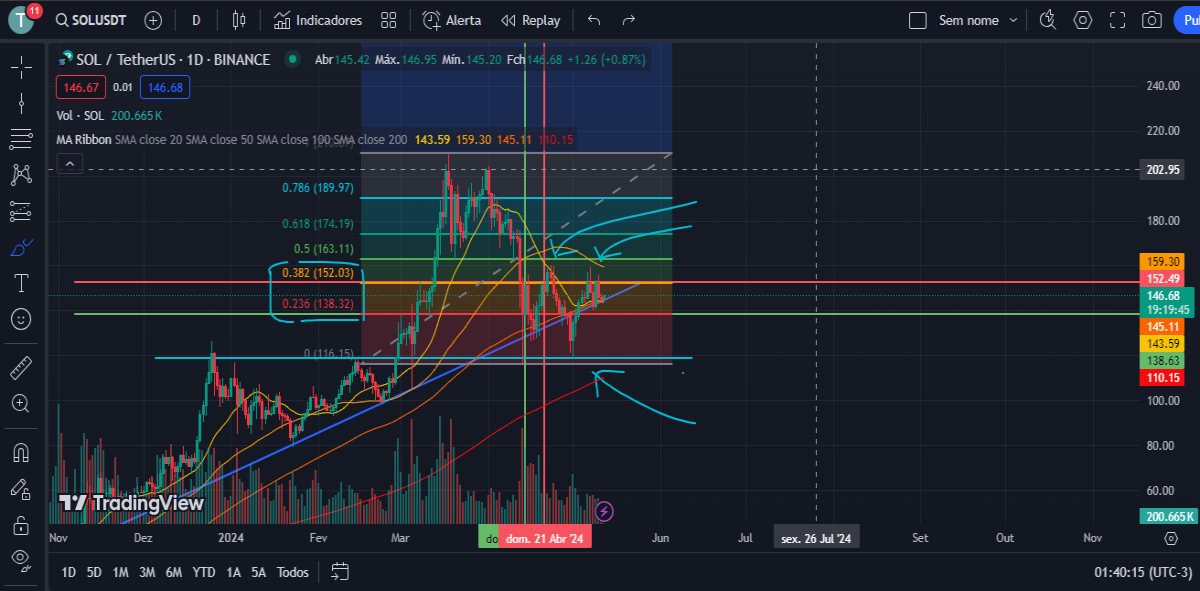
Green lines, day and purchase value.
Lines in red, day and sales value.
Notice the perfection in this well-drawn graph, the perfect targets, and for this operation, I just needed to place the targets and relax without having to look. After the strong sell-off on the 13th, only the most knowledgeable would know where it would go. Note that it was pulling the price exactly to the areas of a month ago, that is, a cooling and natural correction movement considering the strong increase that left the market breathing hard in the first days of the month.
Note the precision of the prices on the Fibo retracement lines, which suggests that all movements were precisely calculated by the whales and experienced traders, who used the metrics as a basis for building pricing (what a work of art), once again , the only losers are the sardines.
Explaining the operation: upon noticing the strong drop on the 13th, I needed confirmation, which was followed by the support formed at the beginning of the month and the quick position of the market (players) in seeing that the pricing was already fair for a purchase, the which formed a long and large pavilion on the candlestick of the 13th. Following this data, and I admit that I was a little late, as if I had seen it earlier I would have gotten bigger profits, I entered with prices in two zones, a purchase zone at 138.63 and the sell zone at 152.49 (estimated zones, as when working seriously with statistics, it is something future, but these would be the safest zones.)
Could you do another safe operation later? No, as it was a strong breakout of the 100-period moving average. This may indicate a greater probability of decline than continuation, although the price only returned through the strong support zone at 116.5.
I hope you enjoyed this reading/class, good trading to everyone and always stay firm and safe. Do not give your treasures to others.
Support me in becoming a better analyst for all of you.
For negotiations, classes, or analysis contact me on LinkedIn: www.linkedin.com/in/thiago-f-a1094a93/
Donations for this young student.
BTC: 12uJuXTqRUMQTCLxgW5NSHUcwQWNW4WwDW
USDT or TRX TRC-20: TJg2wFrdXsDPLLLeqXKuxcCA9RAvqpfbUk


