Charlie Munger says, "It's always better to buy a great company at a reasonable price than a mediocre one at a cheap price."
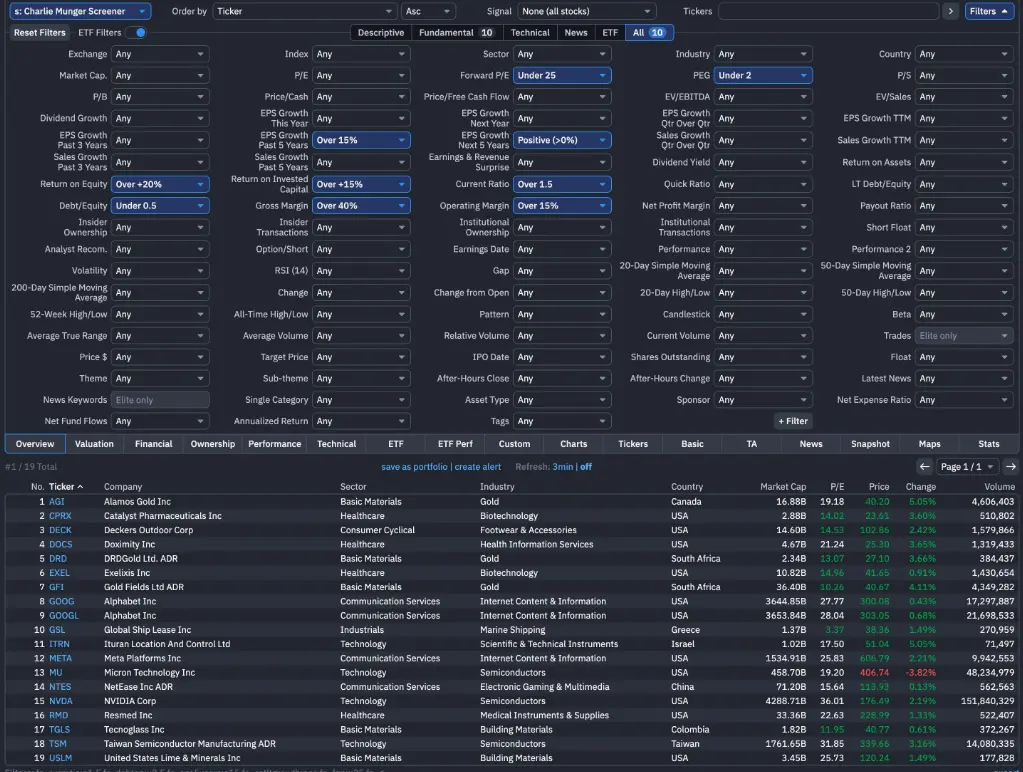
Following Munger's philosophy, I've created a free Finviz screener where you can find quality and inexpensive companies.
Let me explain the details so you know what you're looking for:
For Munger, the most critical metric is the cash flow generated by a business on its invested capital. Therefore, the first metric we'll look at is ROIC; it shows how efficiently a company generates cash, not just from its equity, but from all its operating capital, including debt. It's the most honest figure to tell you if a company truly has a competitive "economic moat."
ROIC: Over +15% (Or for a more ruthless screening, Over +20%). This ratio proves that the net operating profit the company generates from its invested capital clearly exceeds its cost of capital.
ROE (Return on Equity): Over +20% (This is proof of how much profit it can generate from its own equity alone).
A great company has the pricing power to pass on inflation to its customers and doesn't need to take on massive external debt to finance its growth. Therefore, we will also look at these metrics:
Gross Margin: Over +40% (A high gross profit margin proves the company can pass on cost pressures to its prices and isn't being crushed by competition).
Operating Margin: Over +15% (Indicates operational efficiency).
Debt/Equity: Under 0.5 (Munger considered using leverage foolish. Solid companies grow with their own cash flow).
Current Ratio: Over 1.5 (Ideally above 2). This proves how comfortably the company can pay its short-term liabilities within a year with its cash and current assets. When macroeconomic headwinds turn or interest rate shocks occur, the first to fail are companies with weak liquidity. This filter cuts off risk proactively.
Another thing we will look at is that instead of the flat P/E ratios that investors prefer, we are looking for reasonable forward-looking multiples compared to growth potential.
Forward P/E: Under 25 (Guarantees the price isn't excessively high based on future earnings expectations).
PEG Ratio: Under 2 (Indicates whether the price-to-earnings ratio is reasonable relative to the company's growth rate. Values of 2 and above are considered expensive).
Of course, it doesn't end there. We also need to look at the stability of growth and profitability over the last 5 years to see evidence.
EPS growth past 5 years: Over +15% (Confirms that the business model has been tested and works over the last 5 years).
EPS growth next 5 years: Positive (>0%) (The growth story is expected to continue going forward).
Of course, it's not that simple. There's another risk you need to be aware of here. Finviz looks at historical data. A company having generated 20% ROE in the last 5 years doesn't mean that a disruptive technology entering the market tomorrow won't obliterate that gap.
Especially in the technology sector, backward-looking financial ratios cannot indicate a potential patent loss or a new innovation threat on the horizon. Numbers only narrow down the candidates. The final decision should always be based on a fundamental-macro analysis of how relevant the company's product will be in 10 years.
Therefore, you need to analyze each company that appears in the results in detail. Good luck!