
This isn't the first time I write about the REPO chart. I saw it as an excellent indicator for when we'd get the next liquidity crisis, yet most people have never heard of and / or have no idea what REPO represents. Here's a quick recap...
Between years 2020 and 2022, the Federal Reserve printed trillions in dollars to provide liquidity to the banks. What the banks did in turn was park a massive chunk of that cash right back at the FED, in order to earn interest, known as the Overnight Reverse Repurchase Agreement. Sound confusing? To most people, it is. By December 30, 2022 an insane $2.553 trillion in cash was parked into the FED REPO accounts. That was a lot of cash that was NOT lent out to business and consumers as it was meant to be. Instead, the banks sat on it to earn interest. But...
Around the spring of 2023, I began to notice something. The REPO chart began to show a steady decline in the amount of cash held there. Recall, this was around the same time the FED and other central banks around the world began raising interest rates aggressively, while the FED also embarked on a quantitative tightening cycle, essentially burning cash out of the system in order to quell rising inflationary pressure.
Here is the chart I am talking about...
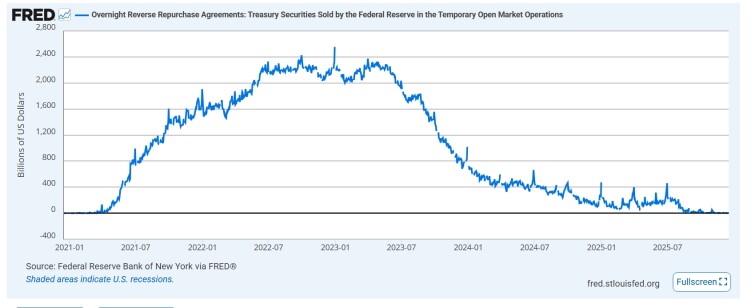
I stated in a previous post here on PublishOx in the spring of 2024, warning that when this chart goes to zero or near zero, we would have ourselves a 'little' liquidity crisis. You see, the banks have been dipping into this account to prop themselves up with instant liquidity for the last 2 and a half years. To me, this was nothing more than stealth Q.E. and now, that well has dried up, from $2.5T down to just $838M by December 12, 2025. Remember this date...
What happened on December 10th? The FED concluded their F.O.M.C. meeting by announcing a 25 basis point rate cut (1/4%) which was widely expected but they didn't stop there. Instead of taking cash out of the system, they were now doing an about face and would begin printing $40 billion per month with the first $8 billion to be created on... December 12, 2025!
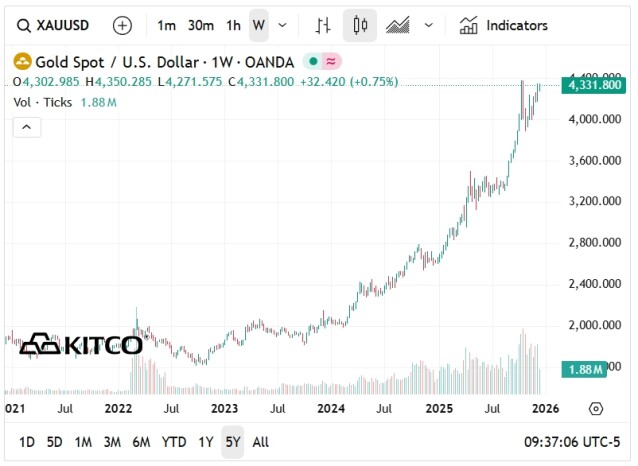
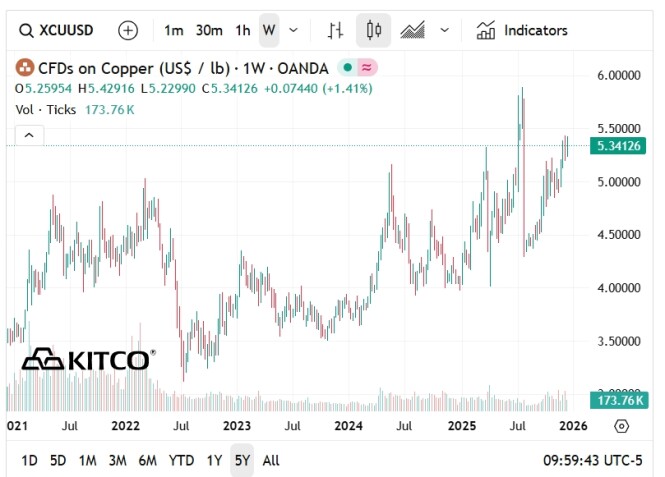
We have ourselves a serious liquidity problem. The Reverse REPO chart predicted this but a few other things were also pointing us in the same direction... Gold, silver and copper!
At present, gold is flying high above $4,300 but have a closer look at the gold chart below, provided by Kitco. The REPO account peaked on December 30, 2022. Incredibly, the gold chart shows gold's climb beginning just two months before that peak. As the banks drained their REPO accounts, we can see that gold has been going in the exact opposite direction, hitting new record highs along the way. Coincidence? I think not and by the way, gold is real money!
Silver went above $66 per ounce overnight, setting yet another new fresh record high. While silver's performance was subdued the last few years, obviously because of severe manipulation, it is experiencing a meteoric rise and the 5 year chart says it all... Yes, that is a straight line up on the far right of this chart!
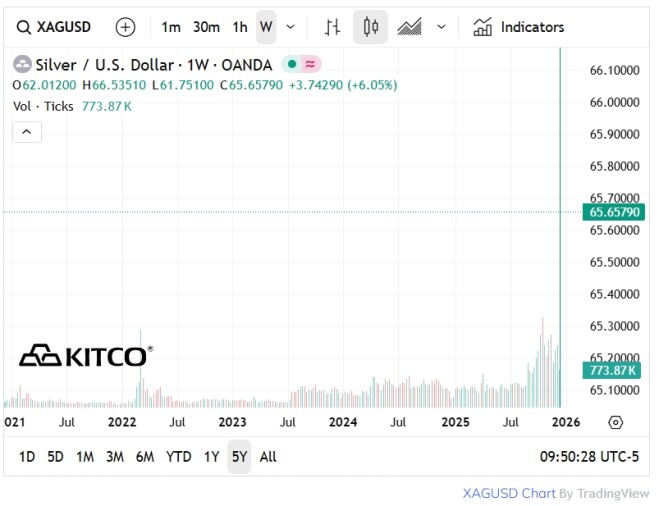
Silver too, shows that it tried to begin its climb around the fall of 2023, as did gold. Last week, the COMEX was trading a billion or more PAPER silver ounces daily, trying desperately to cover shorts and smack the price back down. It ain't working. Something is breaking...
From here, let's have a look at copper which also has seen record highs this year and is poised for higher prices. We can also see here that since the Fall of 2023, copper has been steadily rising. Copper too, like silver and gold is likely heavily manipulated by the futures market, again mostly trading paper, not physical.
Now, interest rates are being pushed down and more money printing has already begun. I knew it was going to happen for the Reverse REPO chart told me so. I now expect higher precious metals prices, especially for silver and as gold continues to hit new highs, becoming unaffordable to the average consumer, silver looks even more appealing. Still, as an ounce of silver crosses the $100, as is now happening around the world, including here in Canada where I live, when you include the exchange rates, retailer markups and shipping costs, silver too might become too expensive for the average Joe.
If it comes to that, the next best bet is copper! While heavy and consumes a lot of space, copper remains relatively cheap asset to consider investing in. I also recommend to get out of debt, stay out of and avoid debt at all costs.
Keeping track of the Reverse REPO chart, I was able to pinpoint when a liquidity crisis would hit. I can tell you now, $40B in new money printing per month won't be enough and most likely, more money printing is on the way, in 2026? We will just have to wait and see but we won't have to wait very long since 2026 is mere weeks away.
Got silver? Got gold? Got copper?


