
Coinbase doesn't offer a portfolio tracker — so I'm developing my own.
Coinbase and Coinbase Pro display the bare minimum portfolio information in their web portals:
- The portfolio's current total USD value
- The number, price, and USD value of each coin held
- The current daily percent change of the coins available to trade
Its up to the user to track investment progress towards whatever goals they set. I get the impression from several months of surfing the internet's crypto space that most amateur crypto enthusiasts track investment progress with spreadsheets, digital notes, or pen-and-paper hand calculations — if at all. I certainly fell into the latter category.
I hope to change this by developing a own portfolio tracker using Coinbase Pro's API. I'm implementing the tracker in Python to leverage the engineering data analysis experience I already have. I'll periodically document my progress and issues on this blog for community awareness and collaboration.
First I need to understand how to query the Coinbase Pro API. I learned how to do so by writing a short script that retrieves the BTC-USD price history on a user-defined time range. I'll briefly document the steps below.
My software environment
I'm implementing my portfolio tracker in Anaconda's Python 3 environment. My computer platform is Linux Mint, using a Bash shell. If you want to skip the mid-level discussion and get right into the code, here is the Jupyter Notebook where I demo'd the code below. I'll eventually flesh out the Github repository the Jupyter notebook is in, but until then this blog will do.
BTC price history using the Coinbase Pro API
The first thing we need to do is import the Python modules we'll use to interface with the API and manipulate the data it provides. We'll also define a simple class called "apiwrapper" to make these simple queries straightforward.
import numpy as np
import pandas as pd
from subprocess import Popen, PIPE
import json
from datetime import datetime

class apiwrapper:
    def __init__(
        self,
        name,
        endpoint="https://api.pro.coinbase.com",
        ):
        self.name=name
        self.endpoint=endpoint
    def query(
        self,
        request,
        method="GET",
        ):
        url="%s/%s"%(self.endpoint,request)
        cmd=[
            "curl",
            url,
            ]
        p = Popen(cmd,stdout=PIPE,stderr=PIPE)
        stdout,stderr = p.communicate()
        return json.loads(stdout)
In a nutshell, an apiwrapper object submits a request to the Coinbase Pro API through the following steps in its "query" function:
- Create a URL with the Coinbase Pro API endpoint and a user-provided request string. Request strings are described in the Coinbase Pro API docs.
- Submit the API request via the "curl" shell command and "subprocess" Python module.
According to the Coinbase Pro API documentation, market history data is requested via the following HTTP request:
# HTTP request:
# GET /products/<product-id>/candles
The docs outline four required inputs:
- The desired product
- The start and end datetimes, in ISO 8601 formats
- The granularity of requested data, aka the frequency, in seconds
In our example's case the desired product is 'BTC-USD'. Let's set the start datetime to the Jan. 1, 2021, and the end datetime as the moment of execution. I'll set the granularity to 86400 seconds, or daily.
product_id = "BTC-USD"
start_iso = "2021-01-01T01:00:00Z"
end_iso = datetime.now().strftime("%Y-%m-%dT%H:%M:%SZ")
granularity = "86400" #day
url = "products/%s/candles?start=%s&end=%s&granularity=%s" %(
    product_id,
    start_iso,
    end_iso,
    granularity,
    )

# retreive data:
myapi = apiwrapper("myapi")
btc = myapi.query(url)
This returns a Python list of six-element lists. Here is the output for the first list.
print(btc[0])

# output:
# [1630886400, 51020.08, 52219.95, 51789.17, 51930.86, 7434.62112948]
The six elements are:
- time bucket start time
- price low
- price high
- opening price (first trade) in bucket interval
- closing price (last trade) in the bucket interval
- volume of trading activity during the bucket interval
Things are much more straightforward now that we have the data we want. I'll finish out this demo by converting the data list into a Pandas' dataframe and plotting it.
# create dataframe:
df = pd.DataFrame(btc)
df.columns = ["UTC","low","high","open","close","volume"]

# convert UTC times into human readable:
df["date"] = pd.to_datetime(df.UTC,unit="s")
df = df.set_index("date")

# plot:
plt.figure()
plt.title("""Coinbase Pro API
BTC-USD daily price high query results since Jan 1 2021""")
plt.plot(
    df.index,
    df.high,
    label="BTC-USD",
    )
plt.legend()
plt.grid()
plt.xlabel("date")
plt.xticks(rotation=45)
plt.ylabel("BTC USD value [$]")
plt.tight_layout()
The resultant plot is imaged below.
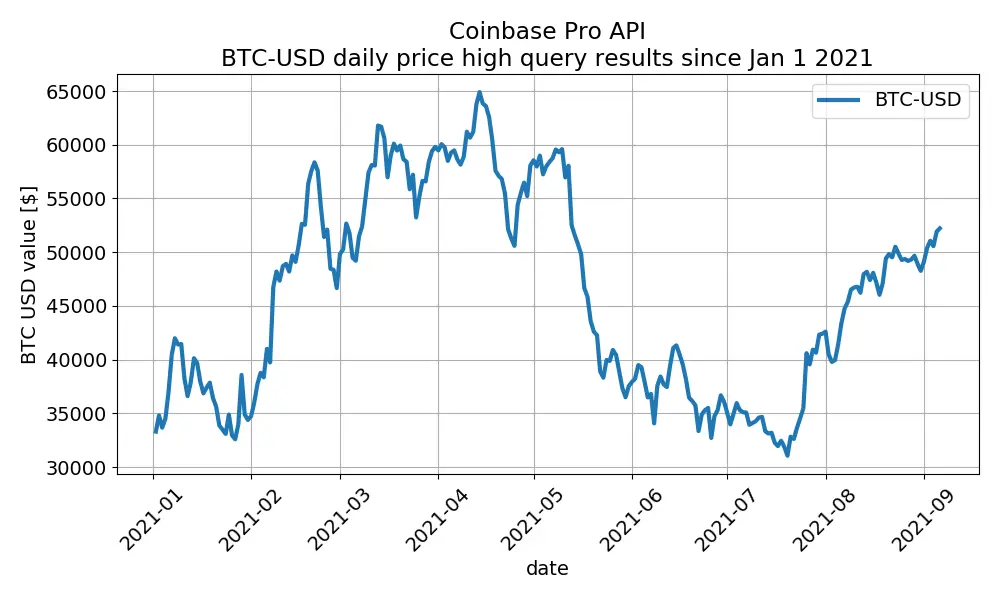
Wrapping up
And there you have it -- we successfully requested the BTC-USD market history from the Coinbase Pro API using Python. The BTC-USD market history is freely available through many online avenues in a much easier manner, but the code snippets above were an important first step for me. They allowed me to develop the capability to submit queries to the API and successfully interpret the returned data. And they served as a "proof-of-concept" that I can interface with the API pro grammatically using free, open-source software.
Stay tuned for more tutorials and documentation. I'll expand the code above soon to query the authenticated part of the Coinbase Pro API so that users can interface with their own portfolios.
As always, thanks for reading! I hope this helps out anyone in a similar situation as myself.






