
Hello, friends! I hope you're well. Welcome to the latest update on XAI. In my previous videos & articles, I discussed how the price of XAI has been respecting the support of a falling broadening wedge pattern on the daily time frame chart. Today, we’ll dive into the latest movements, examine a new downtrend within this pattern, and consider the potential future direction of XAI.
Price Rejection and Formation of a Down Channel
Just two days ago, I shared a video update showing how XAI had bounced from the support of the falling broadening wedge pattern. At that time, the price was approaching the resistance at $0.2735, which had previously acted as support. However, the price was unable to reach this resistance and has since moved down again.
During this downward movement, a new downtrend line has formed, creating a down channel within the broader wedge pattern. This new downtrend has led to multiple rejections, indicating that the price of XAI is facing strong selling pressure.
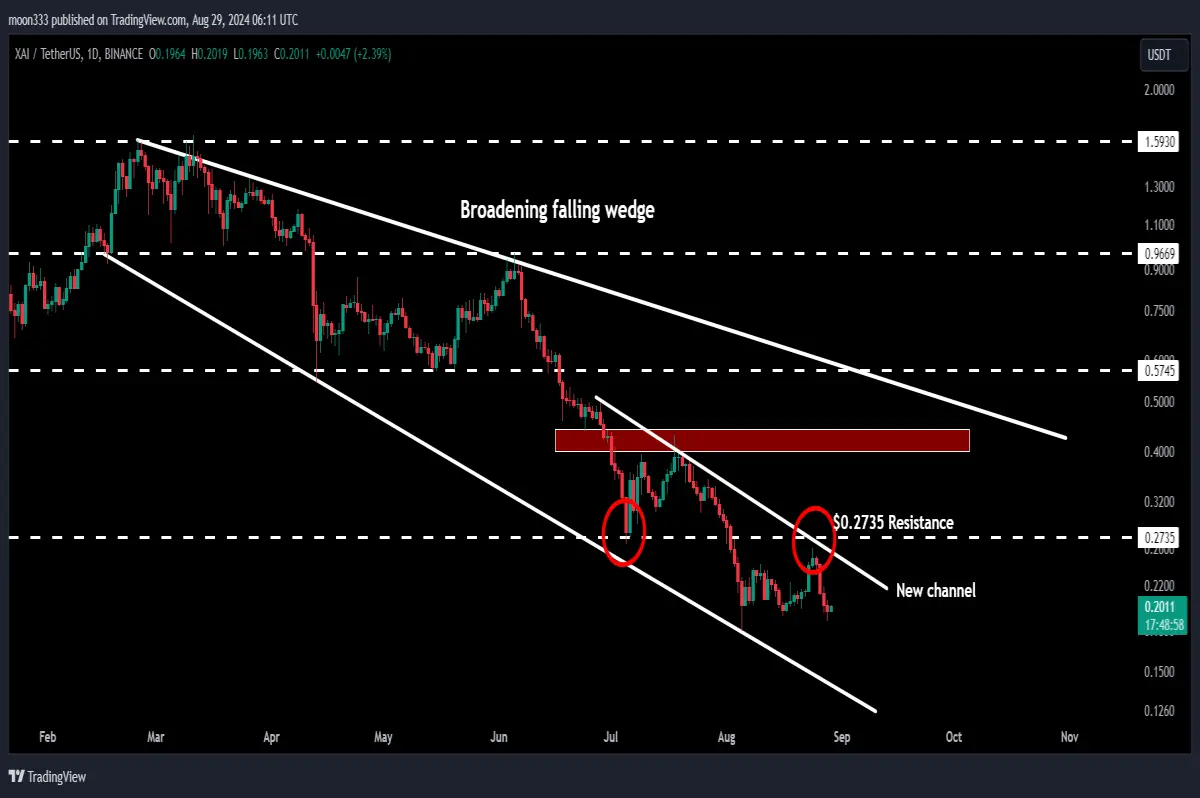
Daily Time Frame Analysis: Broadening Wedge and Down Channel
On the daily time frame chart, XAI has been moving within the falling broadening wedge pattern since February 2024. Each time the price bounces from the support of the wedge, it forms lower highs and lower lows after getting rejected by the resistance. The most recent bounce occurred on August 5, 2024, following a strong selloff. However, the price was again rejected by the newly formed downtrend line.
To overcome this downtrend and attempt another move toward the resistance of the broadening wedge pattern, XAI will first need to break out of this down channel. The support of the channel coincides with the support of the broadening wedge, providing a critical level for the price to maintain.
Potential Scenarios: Support and Resistance Levels
If XAI tests the support of the down channel or the broadening wedge pattern, it could drop to around $0.1380 On the other hand, a successful breakout from the down channel could lead the price to the top of the channel, which is approximately $0.57. However, before reaching this level, XAI will encounter resistance between $0.40and $0.44, which previously acted as support.
Should the price line hit the resistance of the broadening wedge pattern again and form another lower high, it could reach somewhere between $0.48 and $0.48. In the event of a breakout from the broadening wedge, the technical target would be much higher, potentially between $1.60 and $2.00.
Conclusion
In summary, XAI is currently navigating a complex pattern with multiple resistance and support levels to watch. The formation of a new downtrend within the broadening wedge adds an additional challenge for the price to overcome. However, if the price can successfully break out of the down channel and ultimately the broadening wedge, significant upside potential could be realized.
If you enjoyed this analysis, please hit the like button and subscribe to the channel for more updates. For additional trading signals, consider joining me as a YouTube or Patreon member. You can find the links in the video description.






