
Introduction
Welcome to the latest update on Stellar (XLM). Recently, Stellar has shown some promising movements, breaking out of key patterns that could lead to significant price changes. In this article, we will analyze these breakouts on various timeframes and discuss potential targets.
Bull Flag Breakout on the 4-Hour Timeframe
In a recent 4-hour timeframe chart, XLM successfully broke out of a bull flag pattern. Following the breakout, there was a brief rally before the price pulled back, testing the support levels. Notably, the price dipped below the recent swing low of 9.29 cents but quickly recovered, establishing a support zone between 9.29 cents and 9.16 cents. This zone, which previously acted as both support and resistance, has once again become a crucial support level.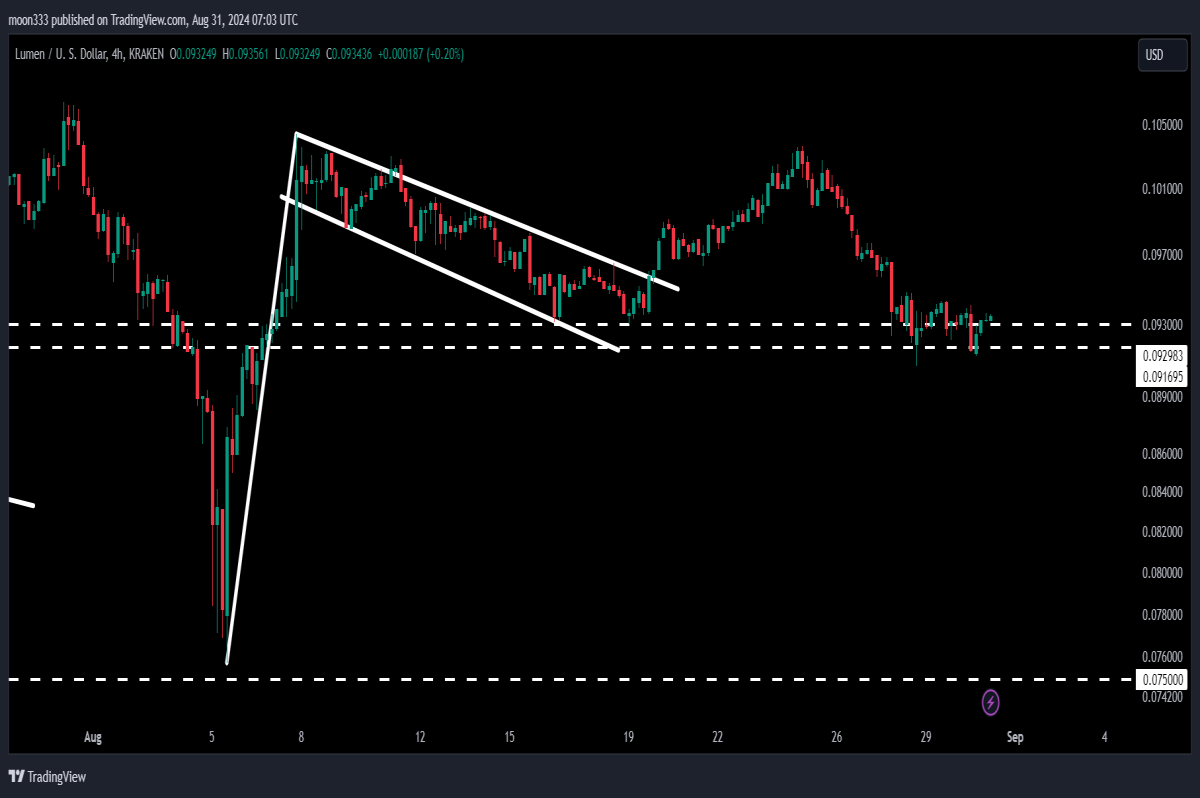
Daily Timeframe: Falling Wedge Pattern Breakout
On the daily timeframe, XLM also broke out from a falling wedge pattern. However, despite the breakout, the price has struggled to surpass the downtrend line resistance, resulting in sideways movement. The technical target for this breakout is set at 16.2 cents, positioned at the top of the pattern.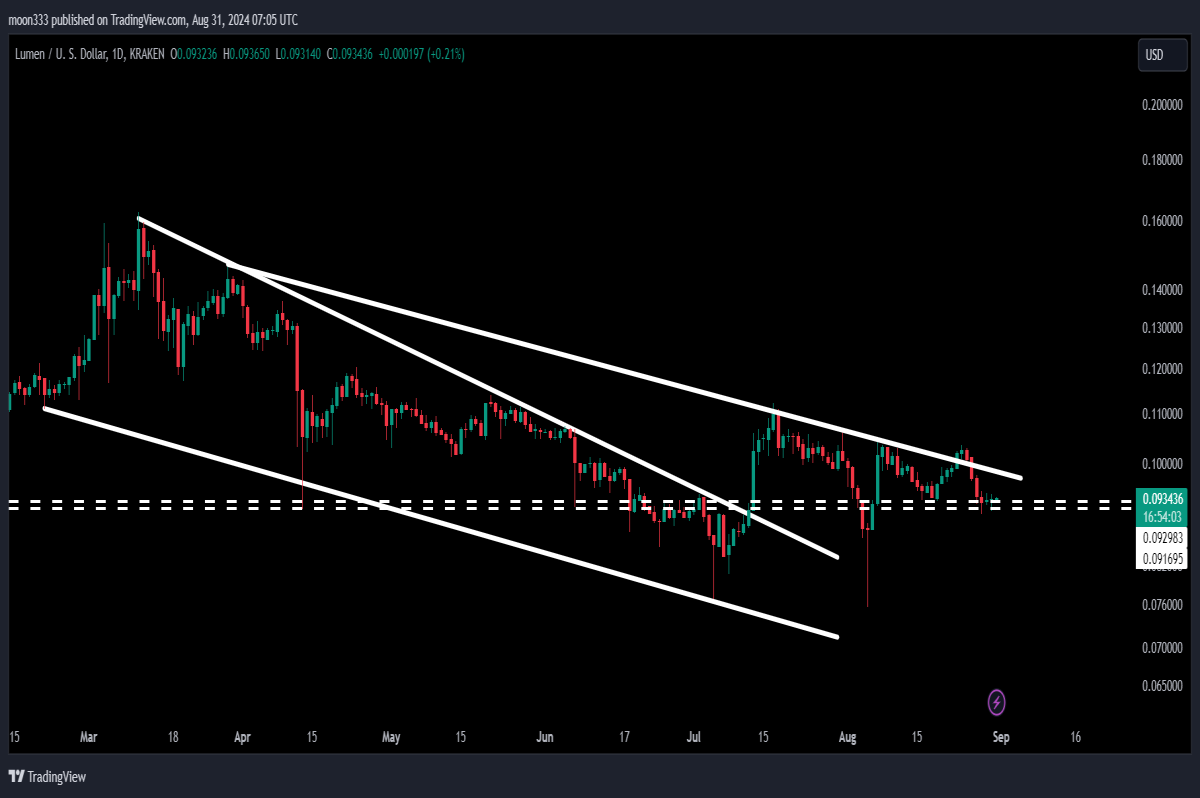
Massive Breakout on the 7-Day Timeframe
One of the most significant developments is the breakout from a long-term falling wedge pattern on the 7-day timeframe chart. Despite the breakout, XLM has not yet reached the target, which is set between 80 cents and $1. This target represents the top of the wedge pattern, and if reached, it would signify a substantial increase in XLM's price.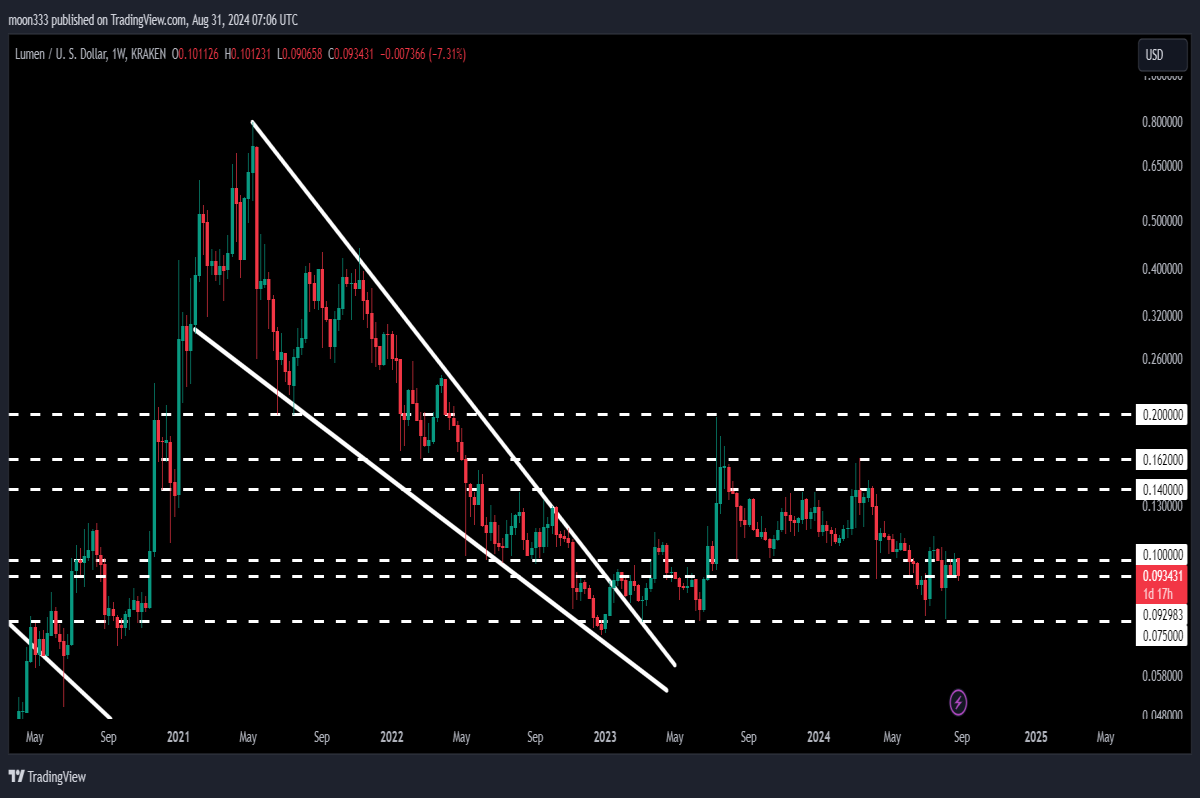
Key Support and Resistance Levels
Currently, the price is testing the support zone between 9.16 cents and 9.29 cents. If this support zone fails, the bull flag breakout could be invalidated. However, if the support holds, we could see a move towards the next target of 13.1 cents, with the potential to reach long-term resistance around 14 cents.
Conclusion
Stellar (XLM) has shown strong bullish signs with multiple breakouts on different timeframes. However, the price is currently at a critical support level. If the support holds, XLM could reach its next targets, including 13.1 cents and possibly 16.2 cents on the daily timeframe, and between 80 cents and $1 on the long-term chart.
For more trading signals and updates, you can support and join the community on platforms like YouTube or Patreon. Stay tuned for further analysis and trading insights.


