
Introduction
Hello, friends! I hope you're doing well. In today’s update, we’ll analyze KDA on a daily timeframe chart. Recently, KDA broke out of a down-channel, and we will take a closer look at this development. Additionally, we will discuss a previous breakdown from a descending triangle and the potential future price movements. Let’s dive into the details and technical aspects of KDA’s price action.
Recent Breakout and Key Resistance Levels
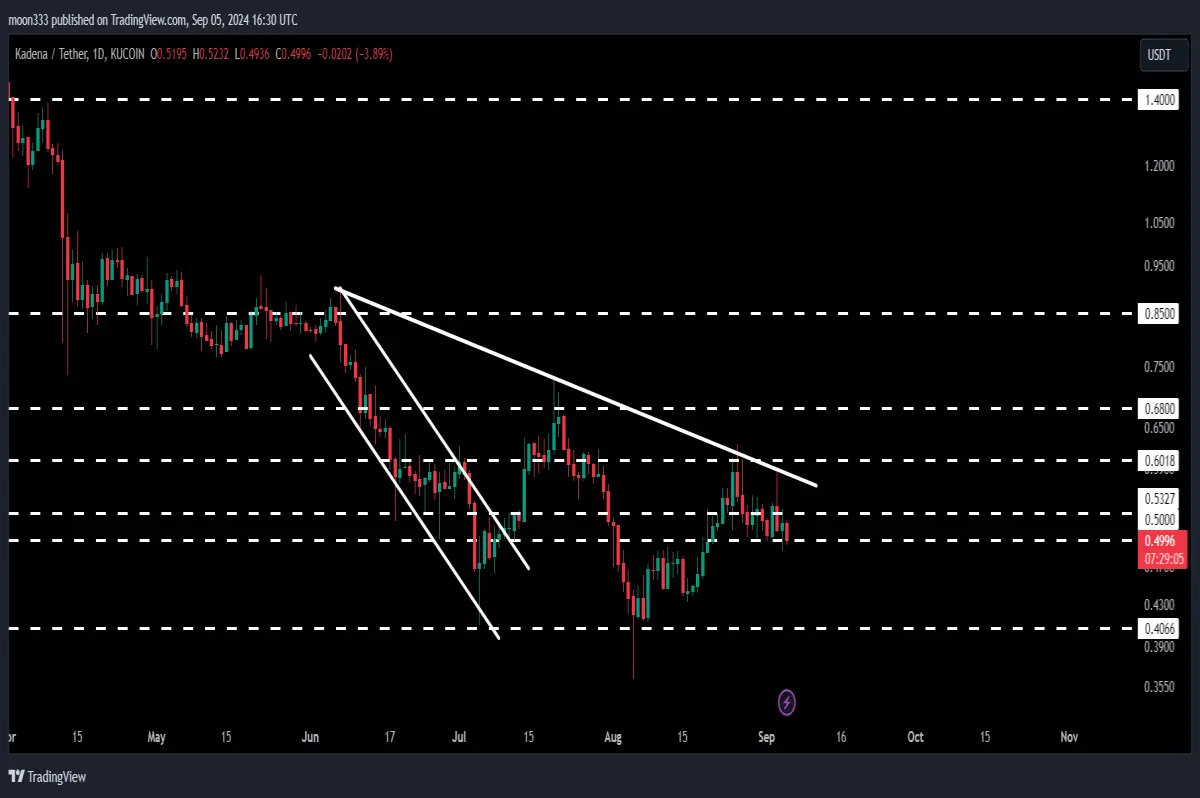
KDA recently broke out of a downward channel. The technical target for this breakout was set at approximately 90 cents, which corresponds to the top of the channel. However, the price could not maintain momentum after the breakout and faced rejection at a downtrend resistance line, which has held strong at various points in recent history.
The price was rejected by this resistance on several occasions, and most recently on September 3, 2024. It is now moving back toward a newly established downtrend support line. This support line has seen two touchpoints so far, and if the price bounces off it again, it could confirm the formation of a wider downward channel.
Support Levels to Watch
At the moment, KDA’s price hasn’t hit the newly established support yet. However, before reaching that level, there is another key support zone near 40 to 41 cents, which aligns with the recent swing low point before the breakout. If the price doesn’t hold here, it may test this lower support level once again.
On the daily timeframe chart, we can see KDA initially broke down from a descending triangle pattern, resulting in a significant drop. Despite this, the price moved within a bullish downtrend channel, which eventually led to the breakout. Unfortunately, the price was rejected multiple times by the 68-cent resistance as well as the downtrend line resistance.
Future Targets and Long-Term Outlook
If KDA successfully breaks out of the downtrend resistance, it could retest the 90-cent target from the earlier breakout. Additionally, there is another resistance level at approximately 76 cents, which was previously the triangle's support. This could present another challenge for KDA before it can achieve its full breakout potential.
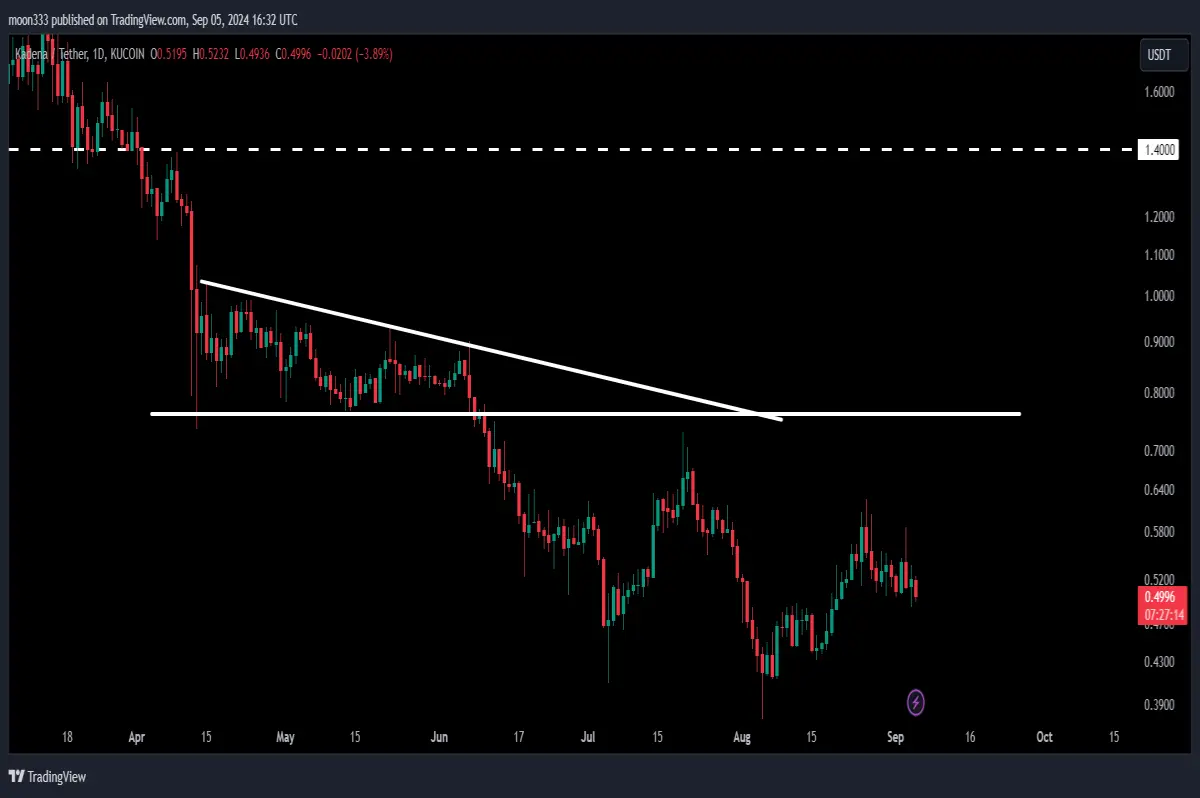
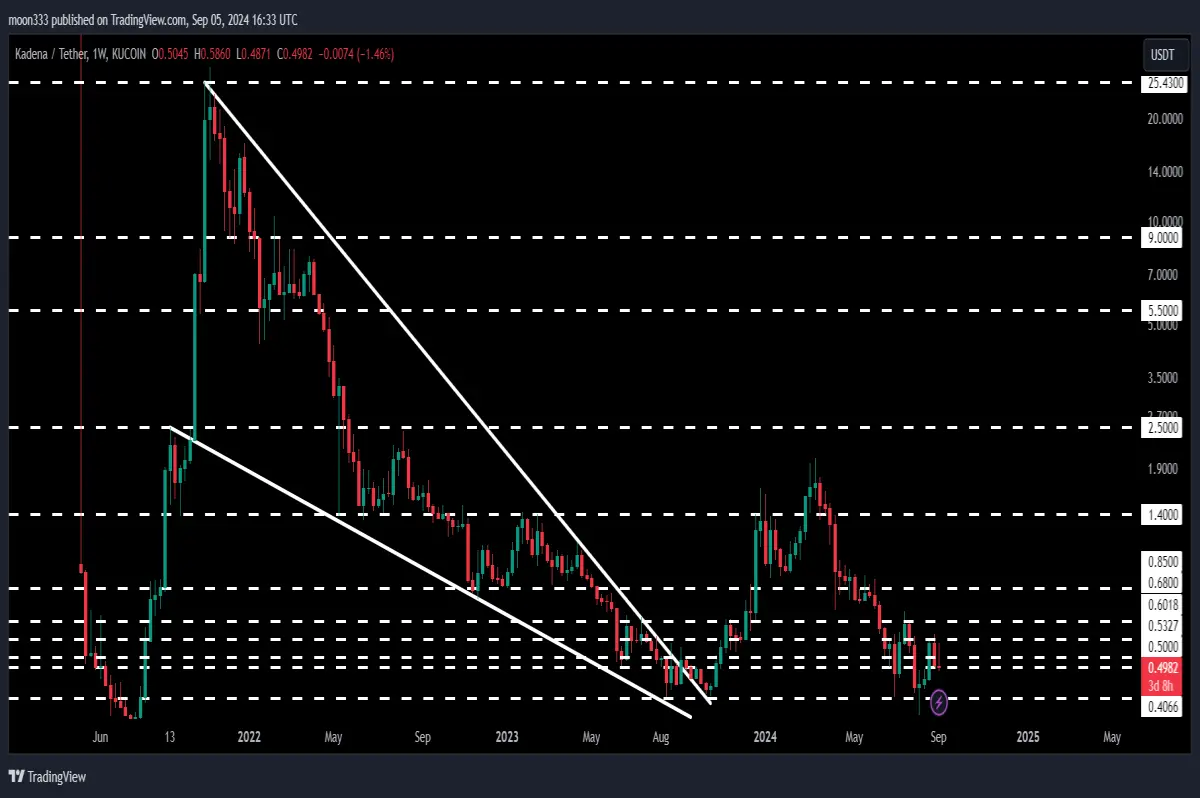
On the weekly timeframe, KDA had previously broken out of a massive falling wedge pattern, resulting in a 400% rally. However, after this significant rally, the price dropped again and recently broke down from the descending triangle.
Looking ahead, if KDA manages to break out of the current downtrend resistance, it could eventually challenge the long-term resistance at $1.40, which was a key support level for several months before becoming a resistance. Multiple rejections have occurred at this level, and breaking it would be a major bullish signal for KDA.
Long-Term Technical Target
The long-term technical target for the breakout from the falling wedge pattern sits between $25 to $30. While there are multiple resistance levels to overcome before reaching this point, a confirmed breakout from the current resistance levels would open the door to this potential price target in the long term.
Conclusion
This concludes the latest update on KDA’s price action and potential future targets. If you enjoyed the analysis, please like the video and subscribe to the channel for more updates. For additional trading signals, consider joining my YouTube or Patreon membership, where I share detailed trade setups and signals.






