
Re-testing the support as resistance:
Today the price line of Bitcoin is retesting the Previous support of the triangle as resistance on a daily timeframe chart. If it breaks out, then we can expect a massive move to the upside. However, if it will be rejected from here then we can expect another retest of $30,000 support. Now it has broken down the support line. Therefore, it is a really important moment for bitcoin as it is retesting the previous resistance as a support and if it will be rejected it can be a kind of bull trap, if you're buying the bitcoin here we can expect a massive drop up to $30,000 that is our next support.

An expected falling wedge: If the priceline of the Bitcoin will be rejected from here then it is also possible that without re-testing the $30K support it will be reversed back to the upside and confirm a falling wedge pattern, which is considered as a bullish reversal pattern among the trader's community.

EMAs 10 and 21:
Here we have the EMA 10 and 21 On the daily time frame chart, and the price action is getting rejected again and again by the EMA 10 on the daily timeframe chart. Once the price action is able to break out this EMA 10 then will be easy for priceline of the leading cryptocurrency to break out the EMA 21 daily as well. Once the price line will break out the EMA 21 then we can expect a massive move after that. We can see that since after the price action cross down the EMA 21 on the 12th of May so far the price line is not able to break out the EMA 10 and 21 on the daily timeframe chart again.

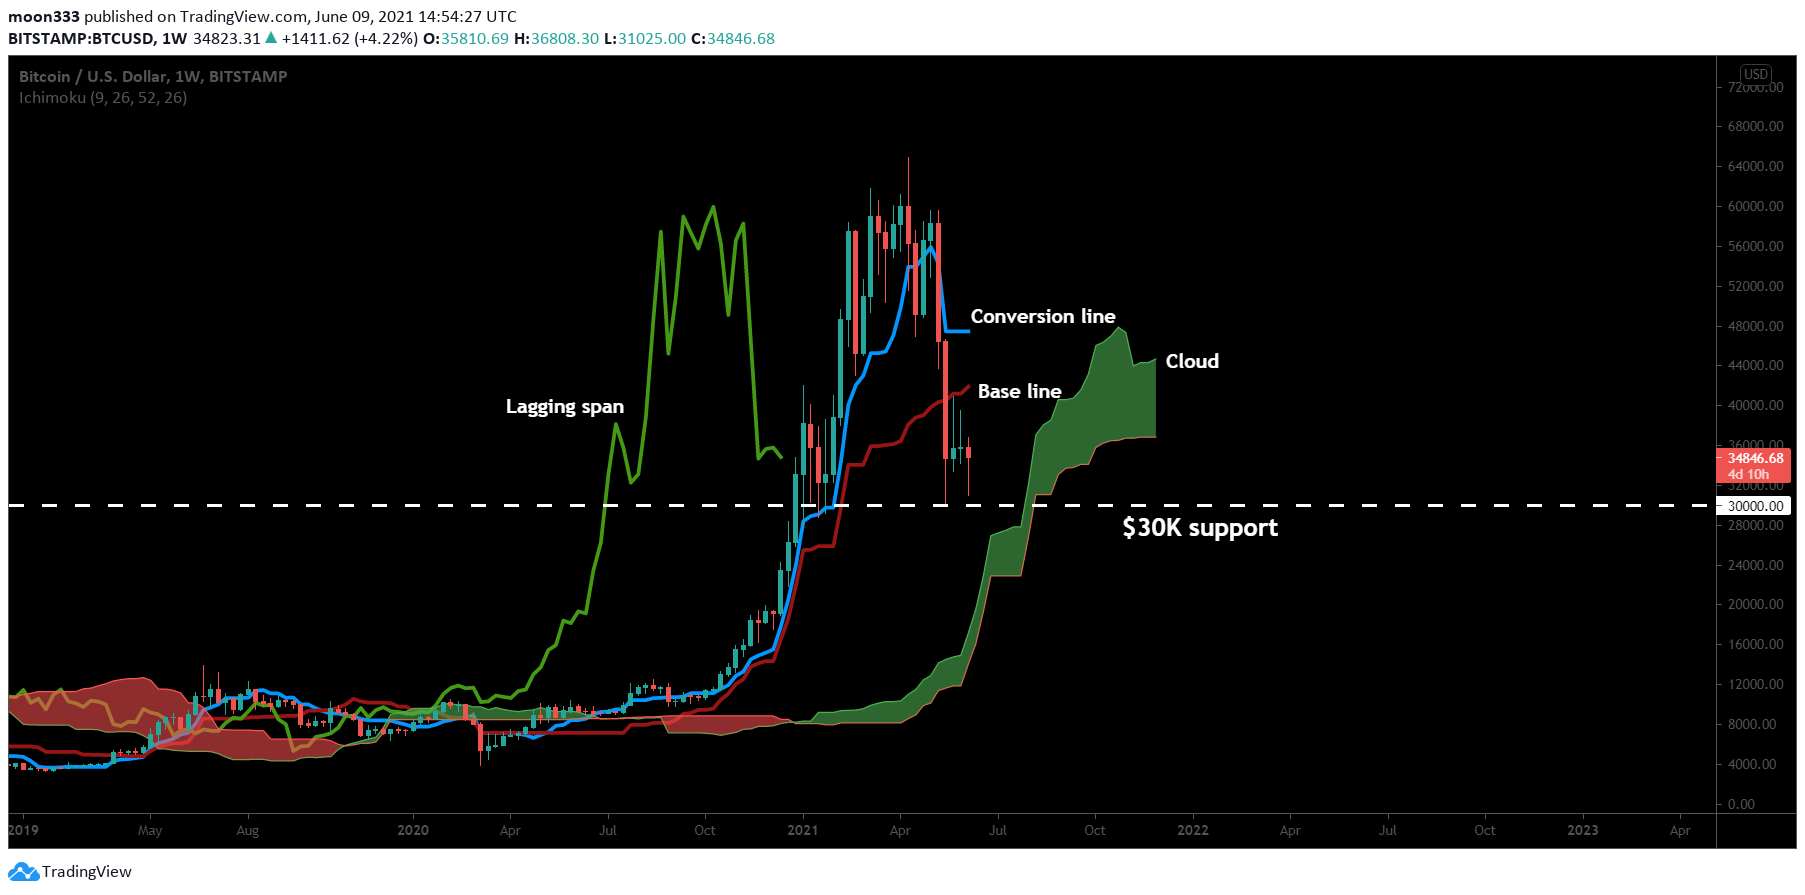
Ichimoku cloud showing the bull run is not ended:
Now I want to show you the Ichimoku cloud on a weekly time frame chart. Previously we have seen that the conversion line (bulue line) was moving down to form the death cross with this baseline (red line) of Ichimoku cloud.
I told you previously that whenever this conversion line of the Ichimoku cloud crosses down the baseline then it is a signal on the weekly time frame chart. We can see that the lagging span previously was moving down aggressively but now it is likely to have a bounce from this support and once we’ll have this lagging span clearly moving to the upside, and the conversion line will start moving to the upside then candlesticks will also start moving to the upside again. Because the price action follows the signals of Ichimoku cloud very well especially on the long term chart.
Conclusion:
Even though the price action of the leading cryptocurrency has been turned bullish but it is re-testing the previous resistance of the triangle as support. In case of rejection, a re-test of $30K support is expected and if the price line of the king of all cryptocurrencies will not re-test the $30K support then a formation of the falling wedge is expected. But if the priceline will break this resistance out then a massive move can be started.
For more harmonic trading ideas you can join:
https://www.patreon.com/moon333
Link for Binance exchange, the best place to buy or sell Crypto:
https://www.binance.com/?ref=11256882
You can also read the below articles:






