
Hi dear friends, hope you are well and welcome to the new update on Bitcoin ( BTC ).
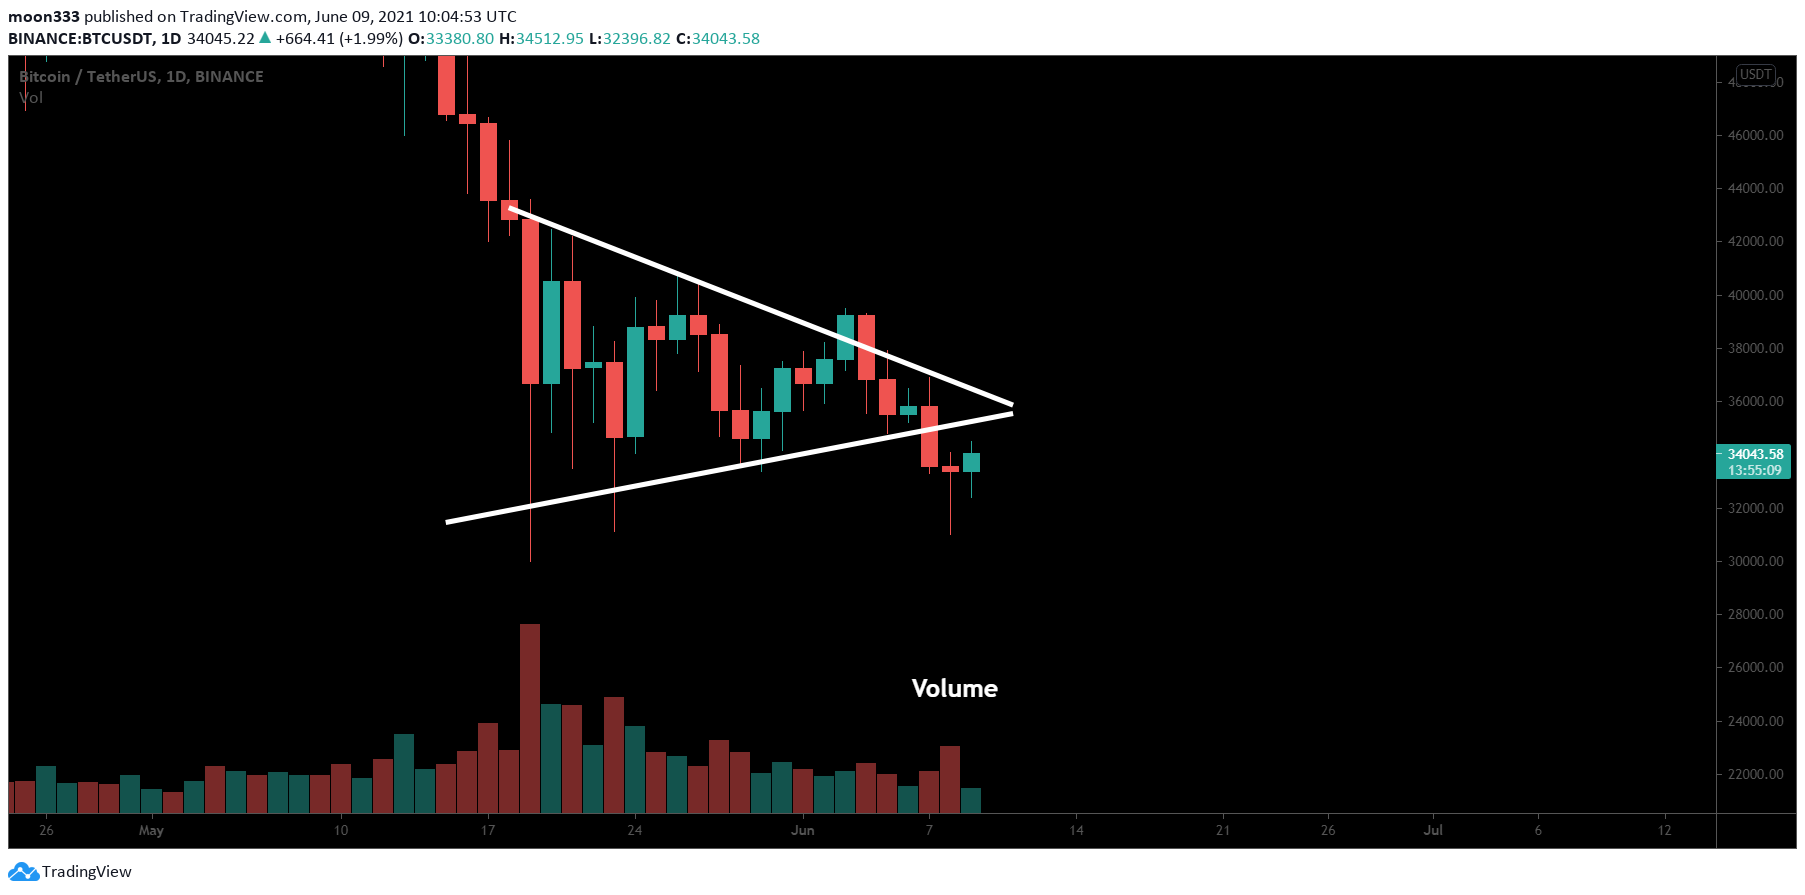
Triangle breakdown:
Previously we have seen that the price action of the leading cryptocurrency was moving at the support of a triangle. On the 4-hourly char, we had several re-tests of this support and the more the priceline tests the support the more there are chances for the breakdown. Therefore, the price action finally broke down the support. Now it might re-test the previous support of the triangle as a resistance. But this breakdown is still not supported by the powerful volume .
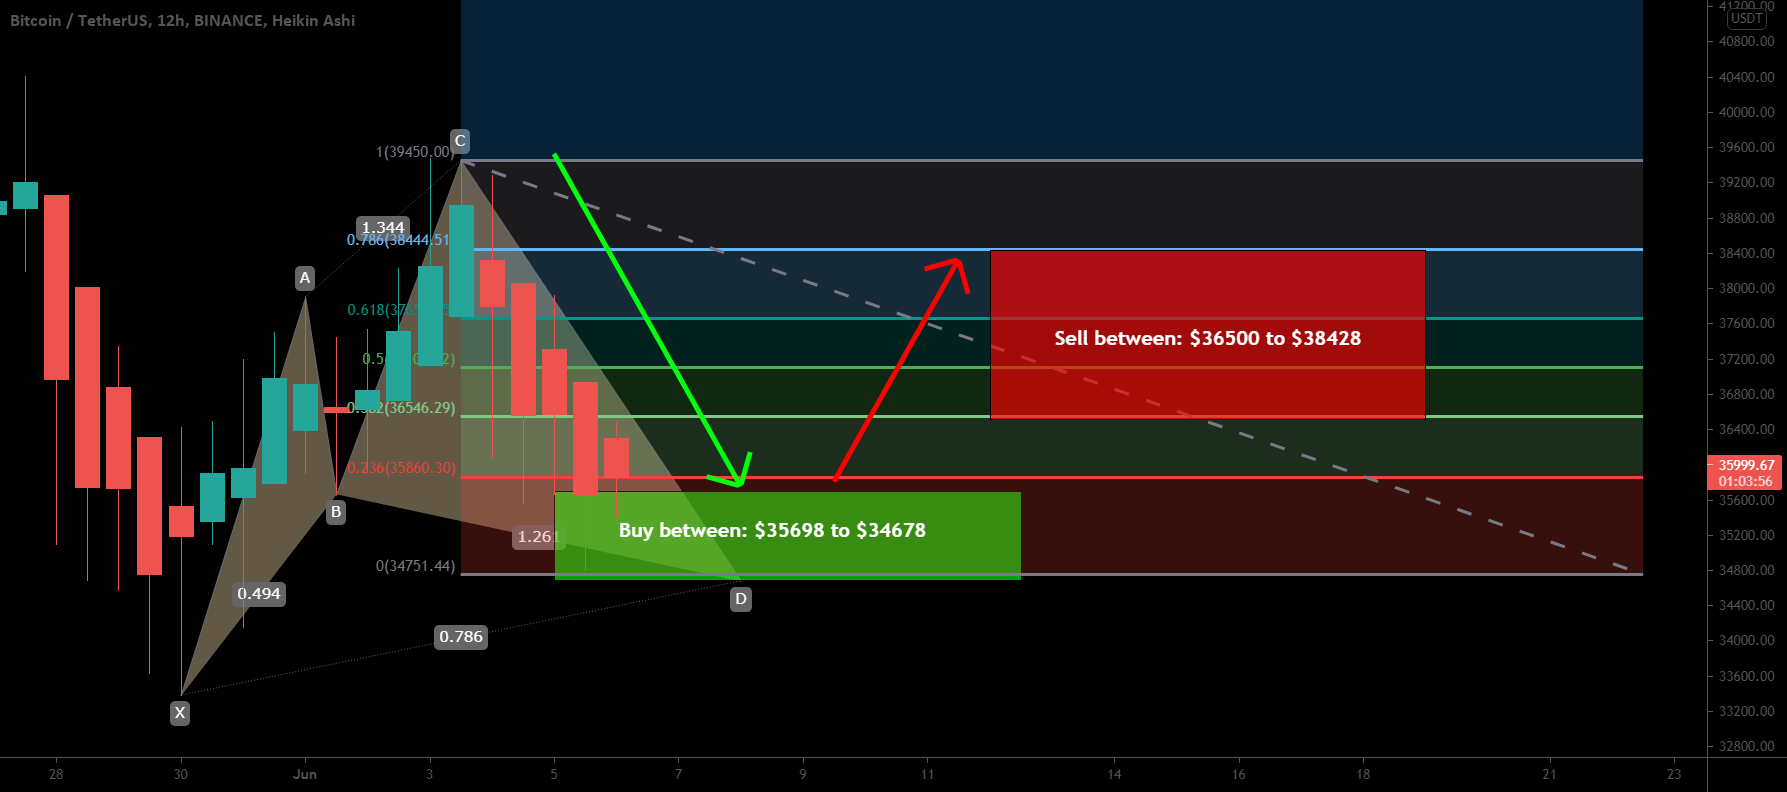
The bullish cypher and weak bullish divergence:
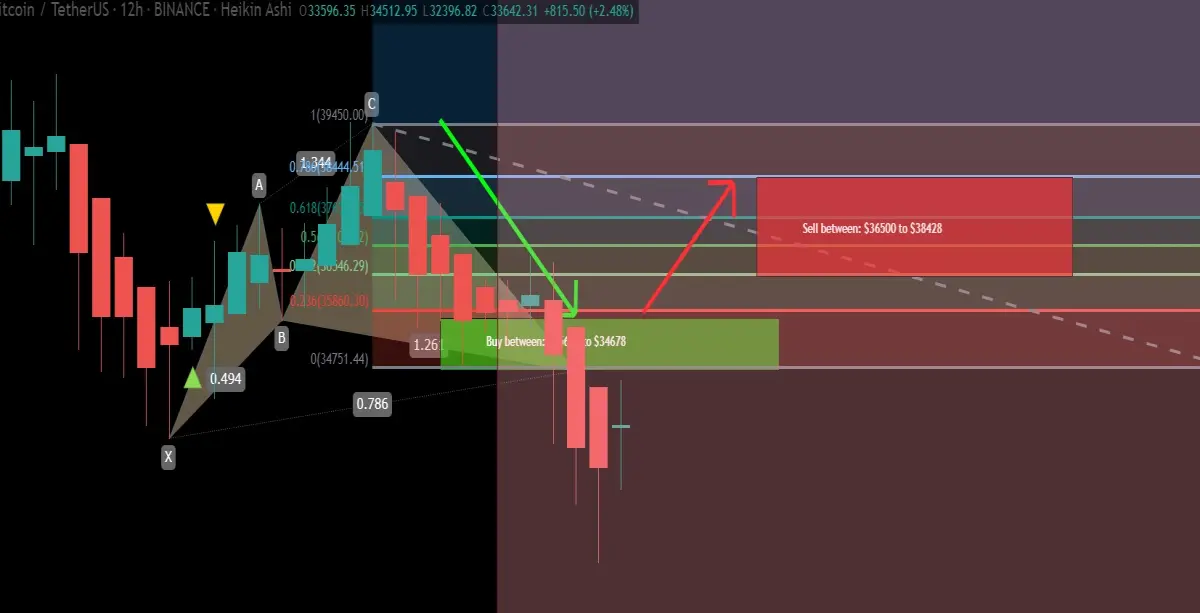
On the daily time frame chart, the price action formed a bullish Cypher . But after taking bounce from the buying zone of this Cypher pattern the price action could not produce a powerful rally and just hit the sell zone and dropped down again. The divergence was also not supported by the powerful buying volume .
After a weak bullish divergence:
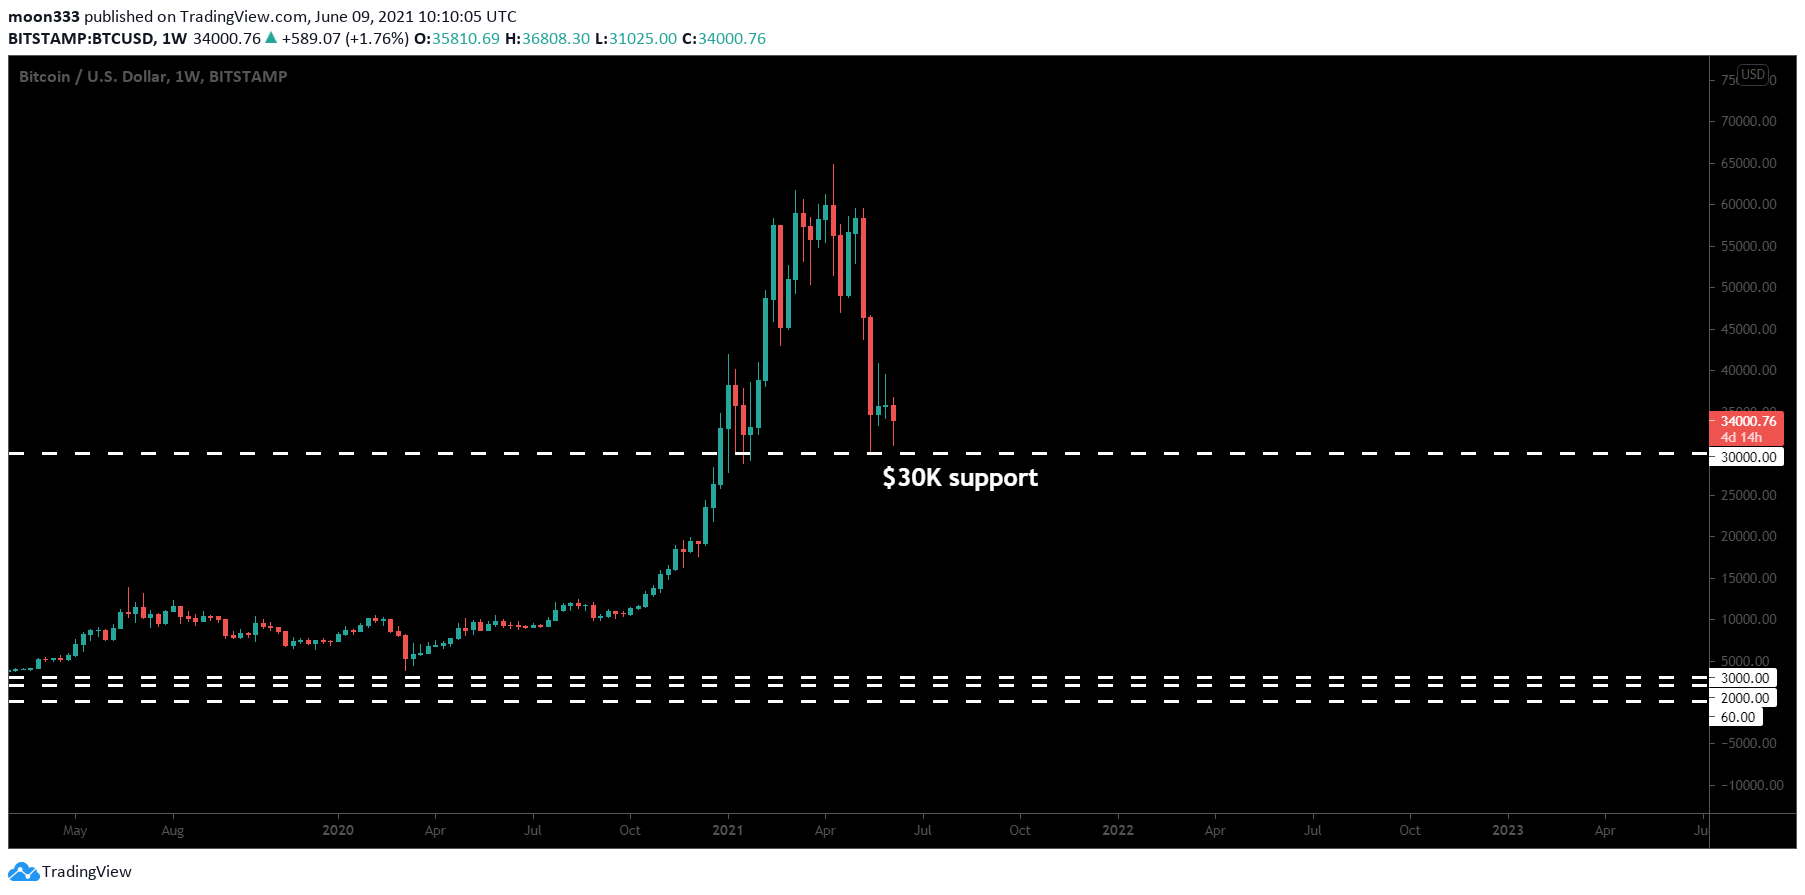
Re-testing the strong support:
After breaking down the triangle the price action reached very close to the strong support of $30K. This is the level where for several days we are observing the buying. Because, whenever the priceline is going to $30K it getting reversed to the upside.
Bollinger bands and the oscillators:
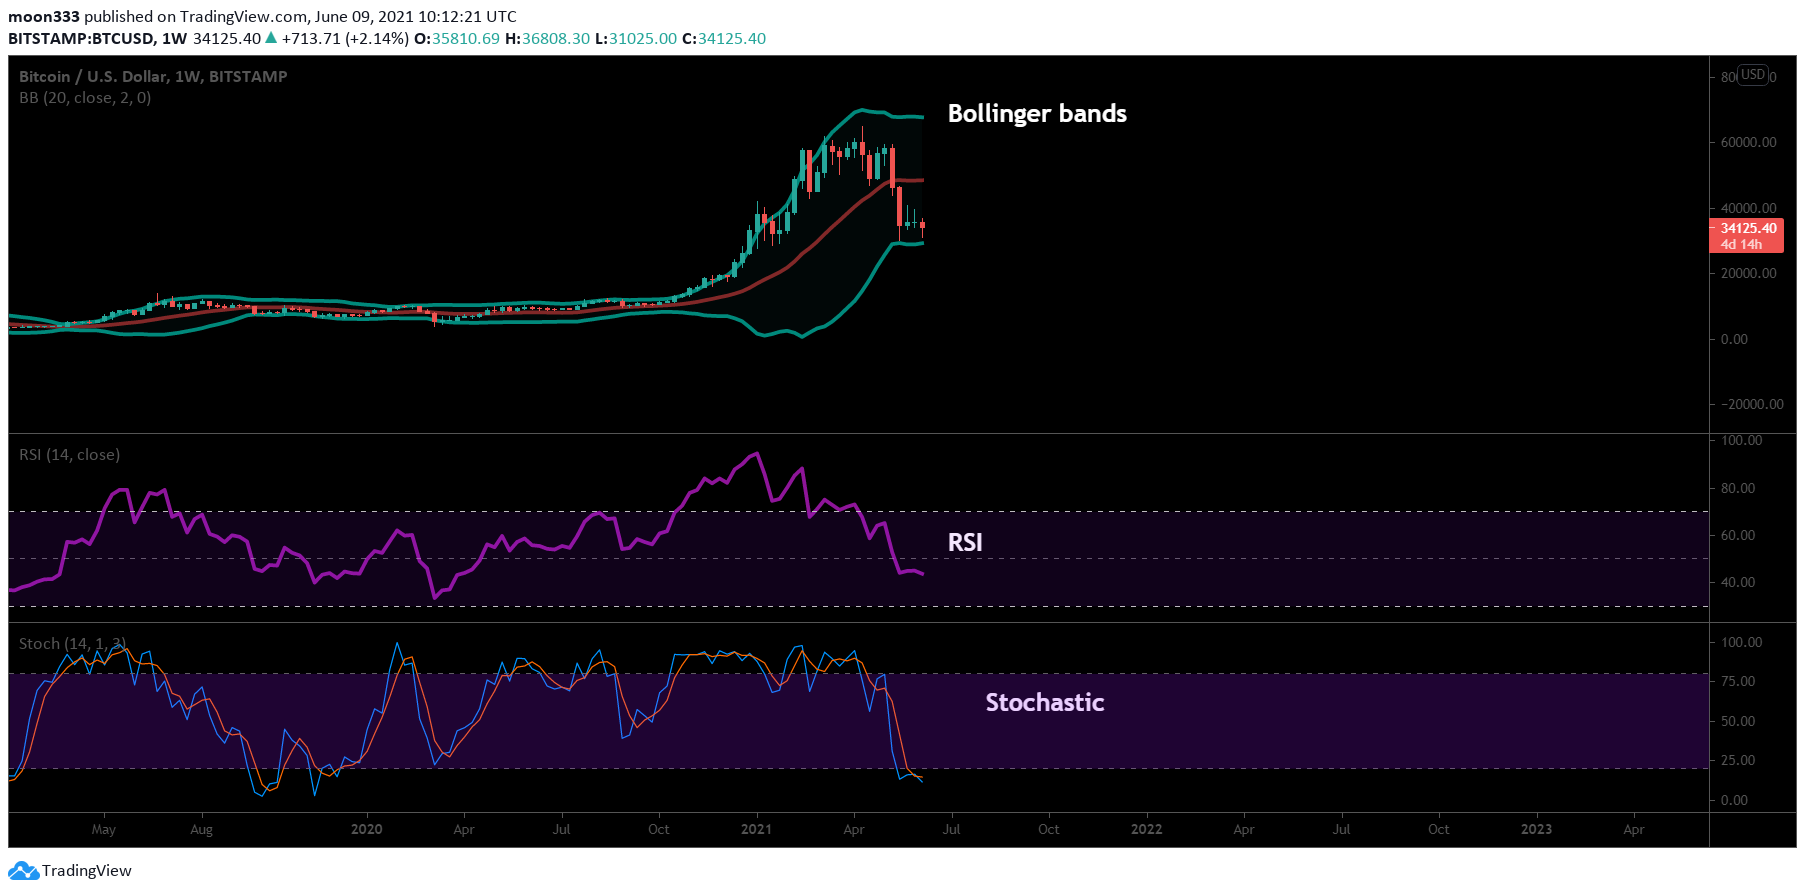
On the weekly chart, the price action is at the support of the lower bands of the Bollinger bands and the RSI is also very close to the oversold zone and stochastic oscillator has already entered the oversold area. Therefore it is difficult for the Bitcoin to breakdown the $30K support.
Death cross and an upcoming correction:
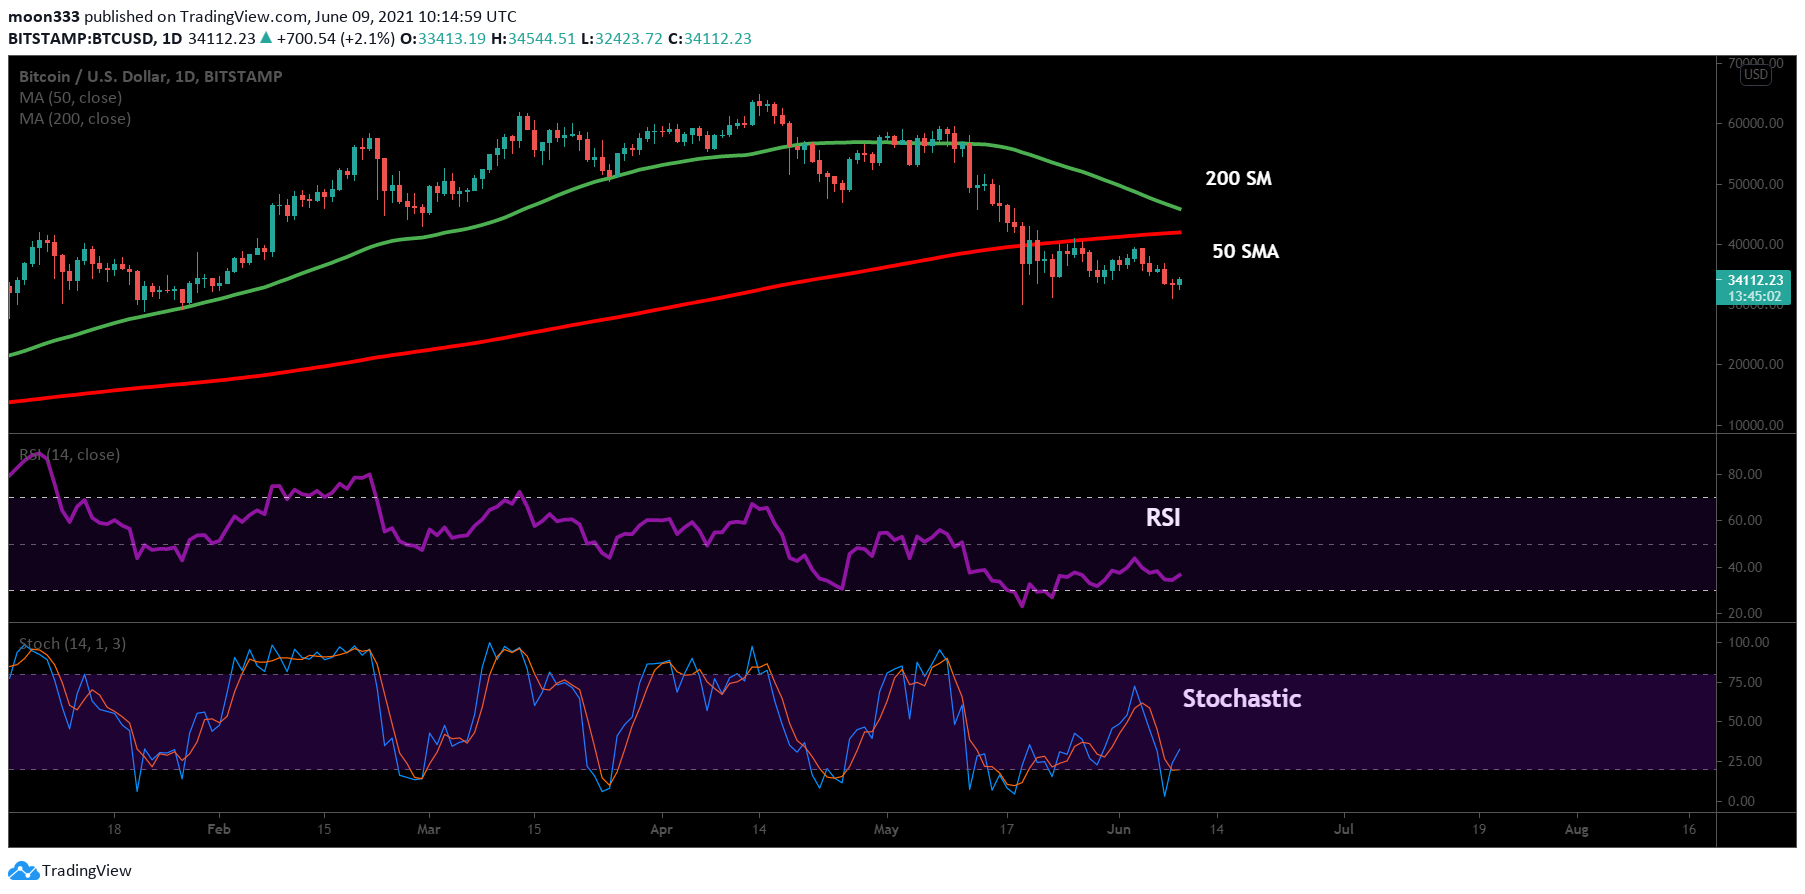
On the daily time frame chart, 50 simple moving average has moved very close to the 200 SMA to cross it down. Therefore, now it is very difficult to avoid this death cross. However, the RSI is already very close to the oversold zone. and the Stochastic has give the bull cross from the oversold zone. Therefore if the death cross happens then sudden after this even a correction to the upside is possible.
Conclusion:
Even though on the short term, we have so many bearish signals but there are several reasons for the starting of the correction rally soon.
For more harmonic trading ideas you can join:
https://www.patreon.com/moon333
Link for Binance exchange, the best place to buy or sell Crypto:
https://www.binance.com/?ref=11256882
You can also read the below articles:






