
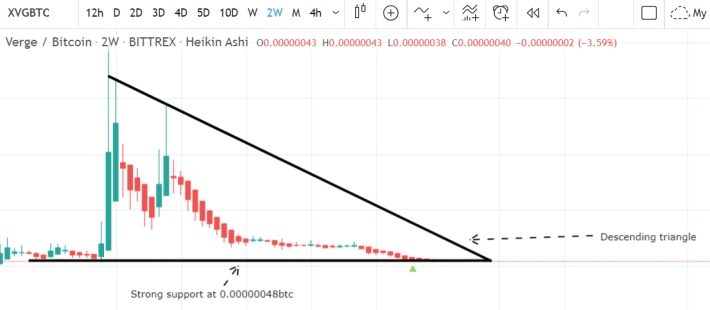
On two week chart XVG / Bitcoin is moving within a descending triangle since july 2017 and the support of this triangle is at 0.00000048 sats which is very firm and cannot be broken sofar.
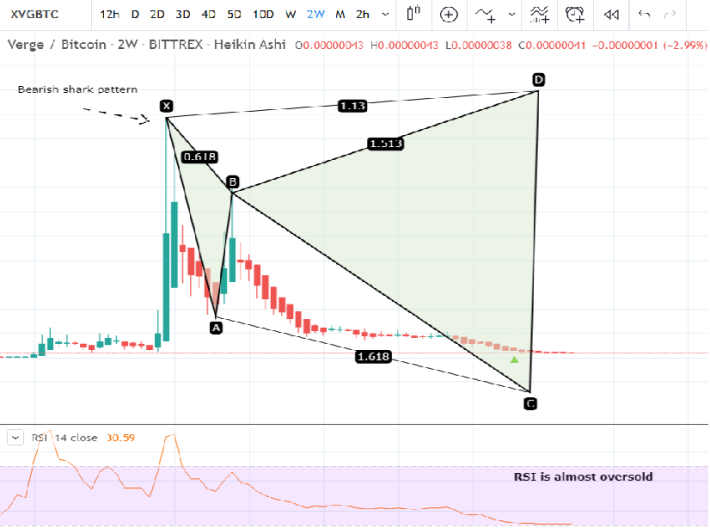
The RSI upto week chart is already oversold and the 2 week chart's RSI is almost near at oversold.
In the meanwhile the price action is also forming a bearish Shark which can lead to huge profit possibility.
Lets have a look at this pattern's dimensions:
After initial leg the A to B leg is retraced between 0.382 to 0.618 and B to C leg is retraced between 1.13 upto 1.618 Fibonacci, these retracements are exactly as required for Shark pattern now we can expect the C to D leg projection between 0.886 to 1.13 Fibonacci as below:
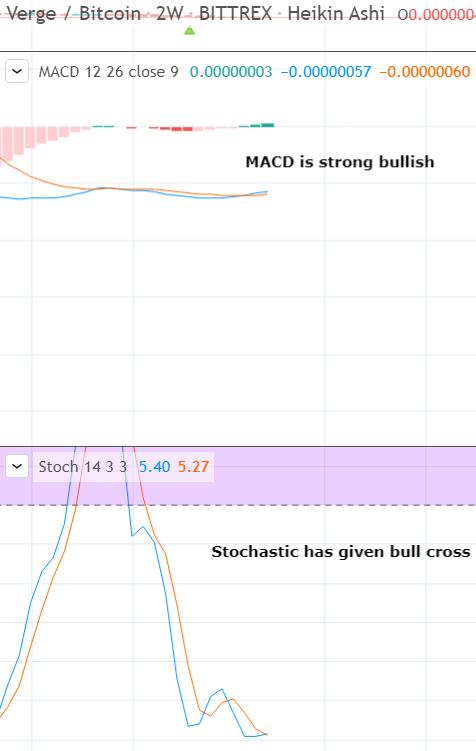
MACD is turned strong bullish and stochastic has given bull cross from the deep of oversold zone:
As per Fibonacci sequence I have defined some secure targets and also aggressive targets upto the completion of shark's leg.
The targets are:
Buy between: 0.00000208 to 0.00000048
Secure sell targets: 0.00000671 to 0.00001331
Aggressive sell targets (Upto the completion of Shark's leg): 0.00001793 to 0.00002194
I have shared this chart on tradingview with complete details.
Regards,
Atif Akbar (Moon333)


