
Introduction
Welcome to the latest update on VeChain. In previous videos, we discussed how VeChain has been moving inside a down channel. Today, we’ll analyze the recent movements and key resistance levels to watch for.
Recent Price Movements and Key Resistance
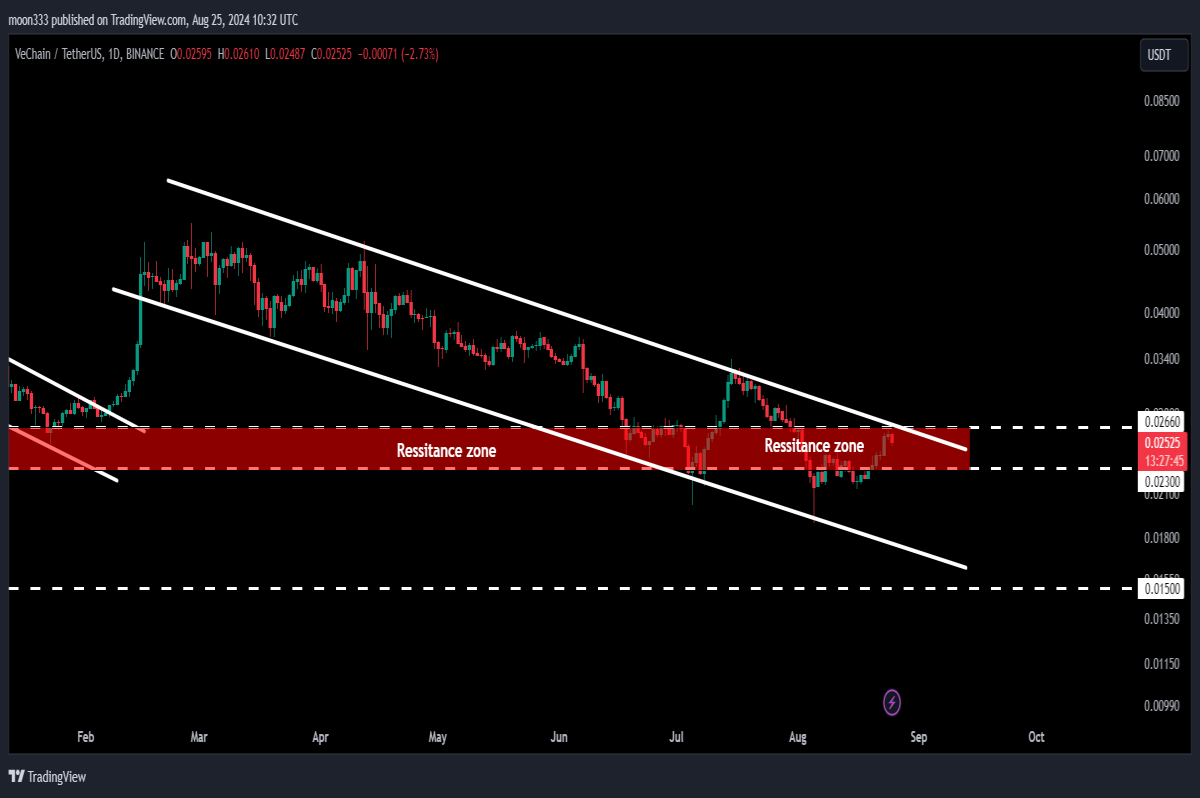
In the daily time frame chart, VeChain has recently bounced from the support of the down channel and is now approaching the channel’s resistance. Simultaneously, it is attempting to break out of a long-term resistance zone that ranges from 2.3 cents to 2.66 cents. This zone has previously acted as both support and resistance, making it a critical level for the current breakout.
Long-Term Support and Resistance Zones
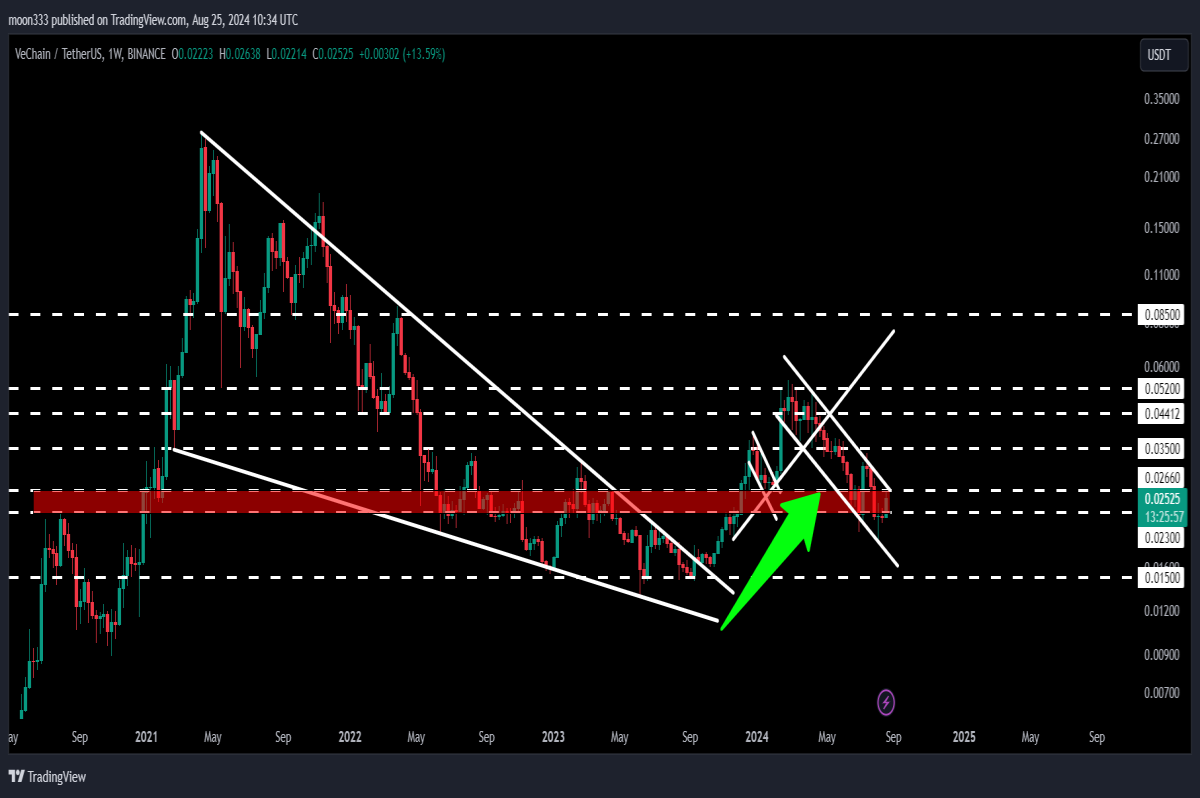
On the 7-day time frame chart, the long-term resistance zone from 2.3 cents to 2.66 cents has shown significant historical importance. It has alternated between acting as support and resistance, making it a crucial level for VeChain's price action. The price is currently challenging this resistance once again.
Channel Analysis and Technical Targets
VeChain has been trading inside a down channel since mid-August 2024. After bouncing off the channel’s support, the price is now approaching the resistance of the channel. If VeChain breaks out of this channel, the technical target is at the top of the channel, approximately 5.4 cents.
Additionally, breaking the resistance of the long-term zone could set the stage for hitting the uptrend line resistance. Historically, this uptrend line has acted as support and may now function as resistance.
For detailed analysis, you can watch the below video:
Weekly Time Frame and Long-Term Potential
On the weekly time frame chart, VeChain has been supported by an uptrend line since November 2023. This uptrend line may now act as resistance. Despite a recent 37% increase following the breakout from a long-term falling wedge pattern, VeChain has yet to surpass the 5.2 cents resistance level.
If VeChain breaks out from the channel and the 5.2 cents resistance, it could target the long-term goal from the falling wedge pattern. The technical target for this pattern ranges between 28 cents and 30 cents.
Conclusion
VeChain is at a pivotal point, testing key resistance levels and potentially setting up for significant upward movement. The breakouts from the channel and long-term resistance zones will be crucial in determining the future price trajectory.
For more detailed trading signals and updates, consider joining as a YouTube or Patreon member, where regular trading insights and setups are shared. Links to join are shared as below.


